
 All blog posts
Labelbox•October 29, 2022
Better understand and visualize data rows to surface high-impact data faster
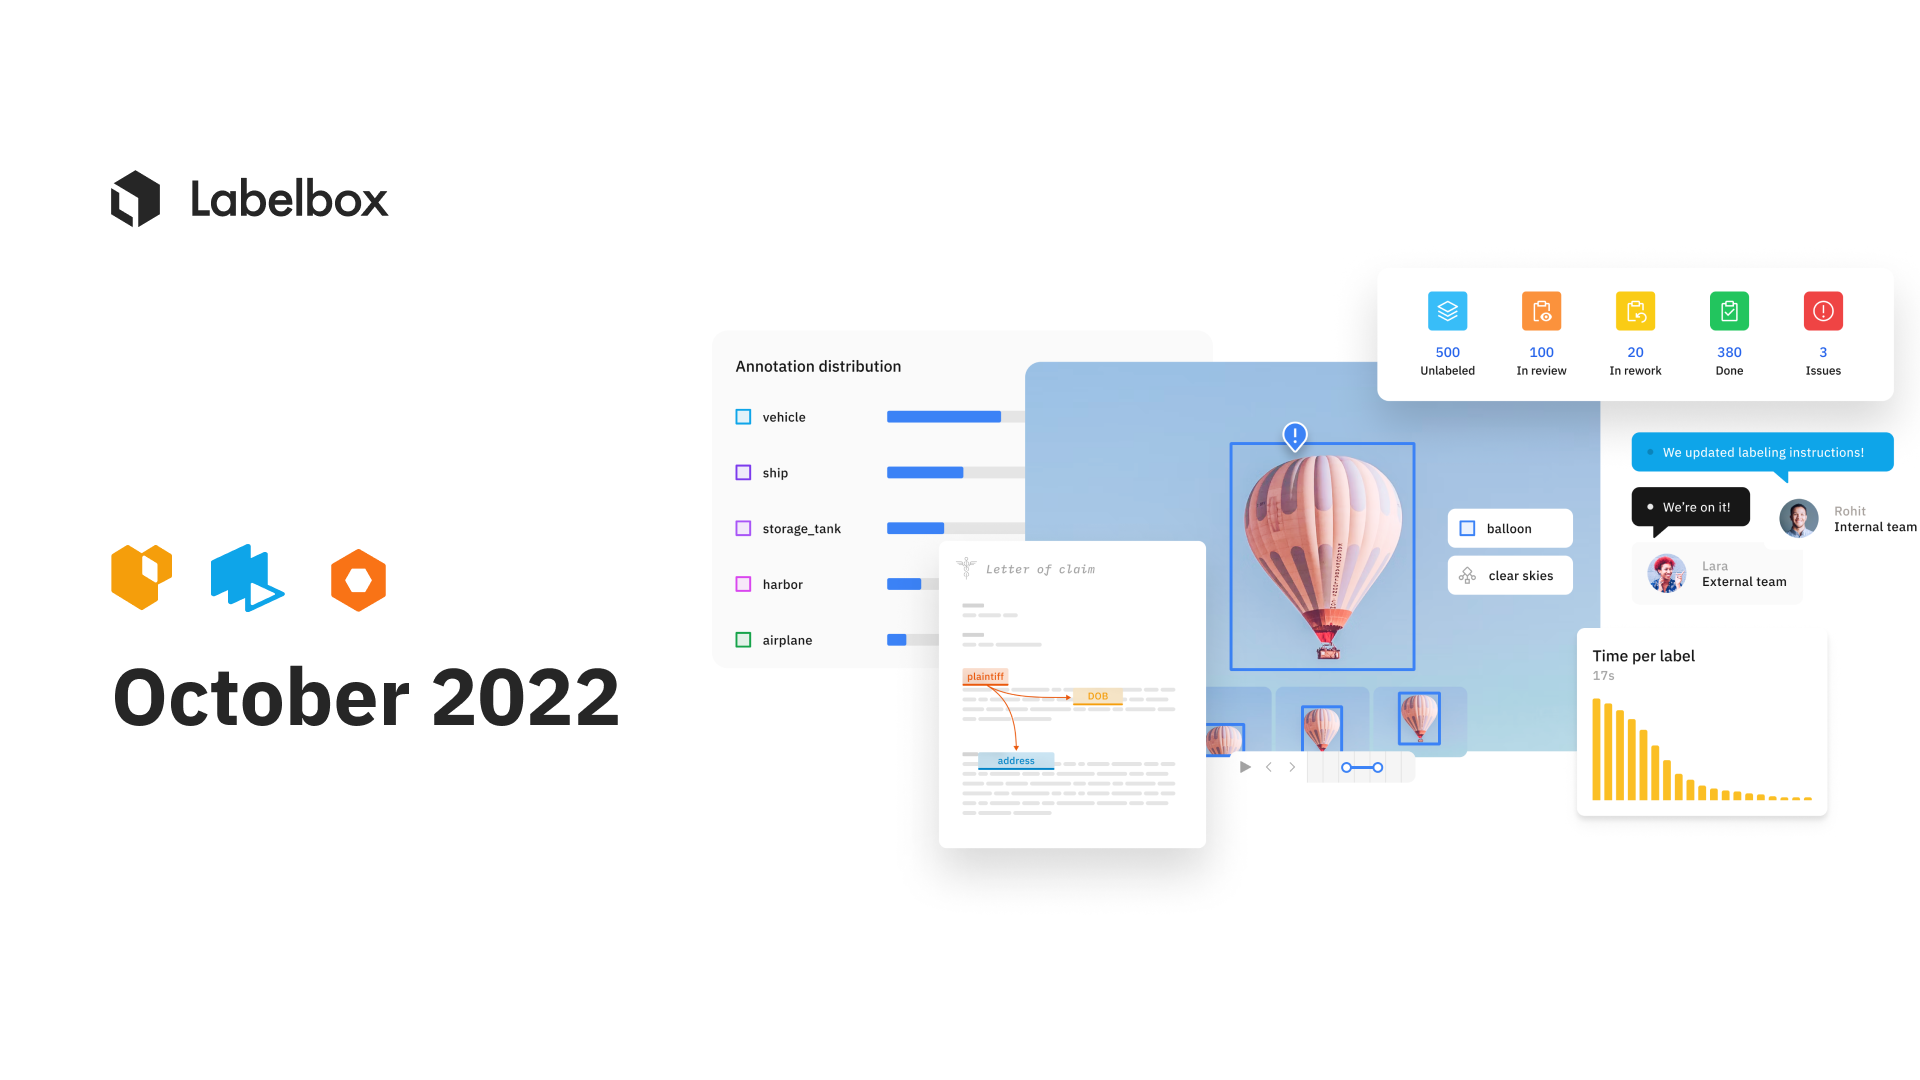
In the past month, Labelbox has made visibility and usability enhancements across Catalog, Annotate, and Model. Teams can now identify and fix data row processing errors, easily reorder ontology nodes, better visualize ground truth and predictions in Model, and more. Read on to learn more about the newest features and capabilities on Labelbox.
Catalog
Save filters as slices to automatically surface high-impact data
In a sea of labeled and unlabeled data, filters in Catalog help teams narrow in on a subset of data. With flexible AND/OR operators, you can conduct complex searches to surface data rows of interest. Slices are now available for all Labelbox users.
A slice is a subset of data rows that share a common characteristic that is determined by one or more filters.
- Create a slice: Teams can now save a filtered search as a "slice". Saving a slice allows you to easily re-use filters in Catalog to surface high-impact data to prioritize for labeling. Every organization can create up to 100 slices.
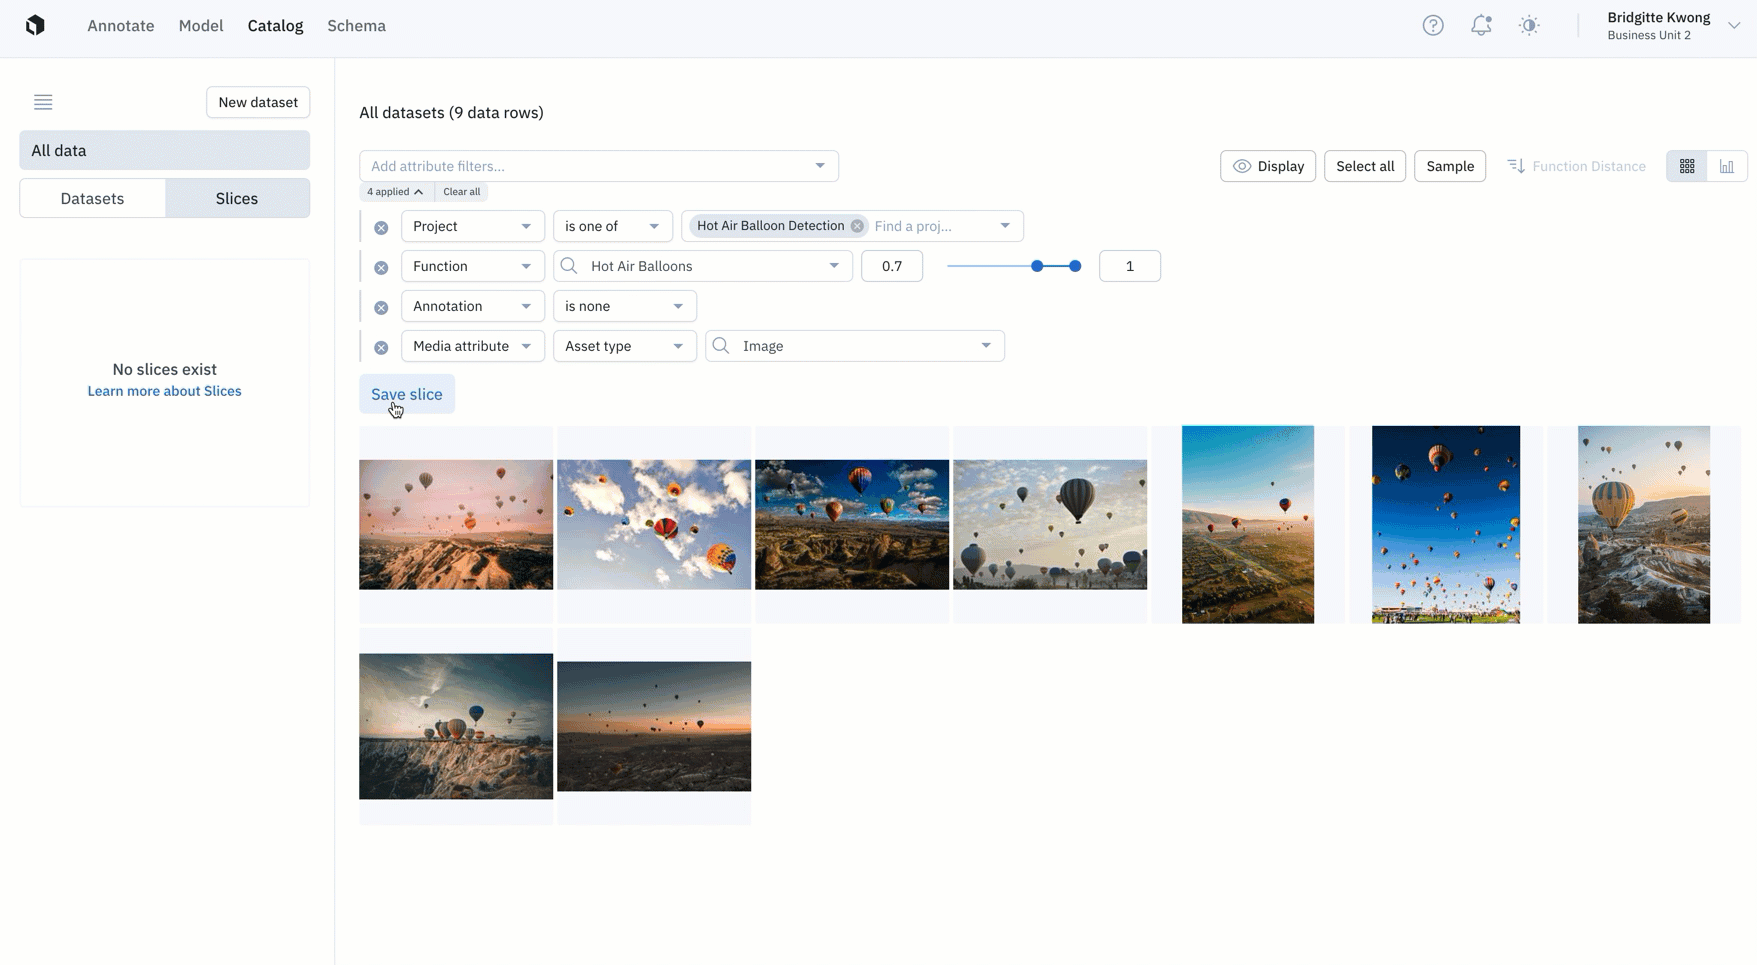
- Explore a slice: You can view your slices in the left side panel of Catalog, where you can view filters and existing data rows for each slice. In Catalog, you can explore and view all of your data, datasets, and slices for a more holistic view of your data rows.
- Update a slice: Over time, if you want to adjust the filter of a slice, you can do so by clicking on the slice of interest. You can directly adjust filter parameters for the existing slice or create a new slice associated with the new filter.
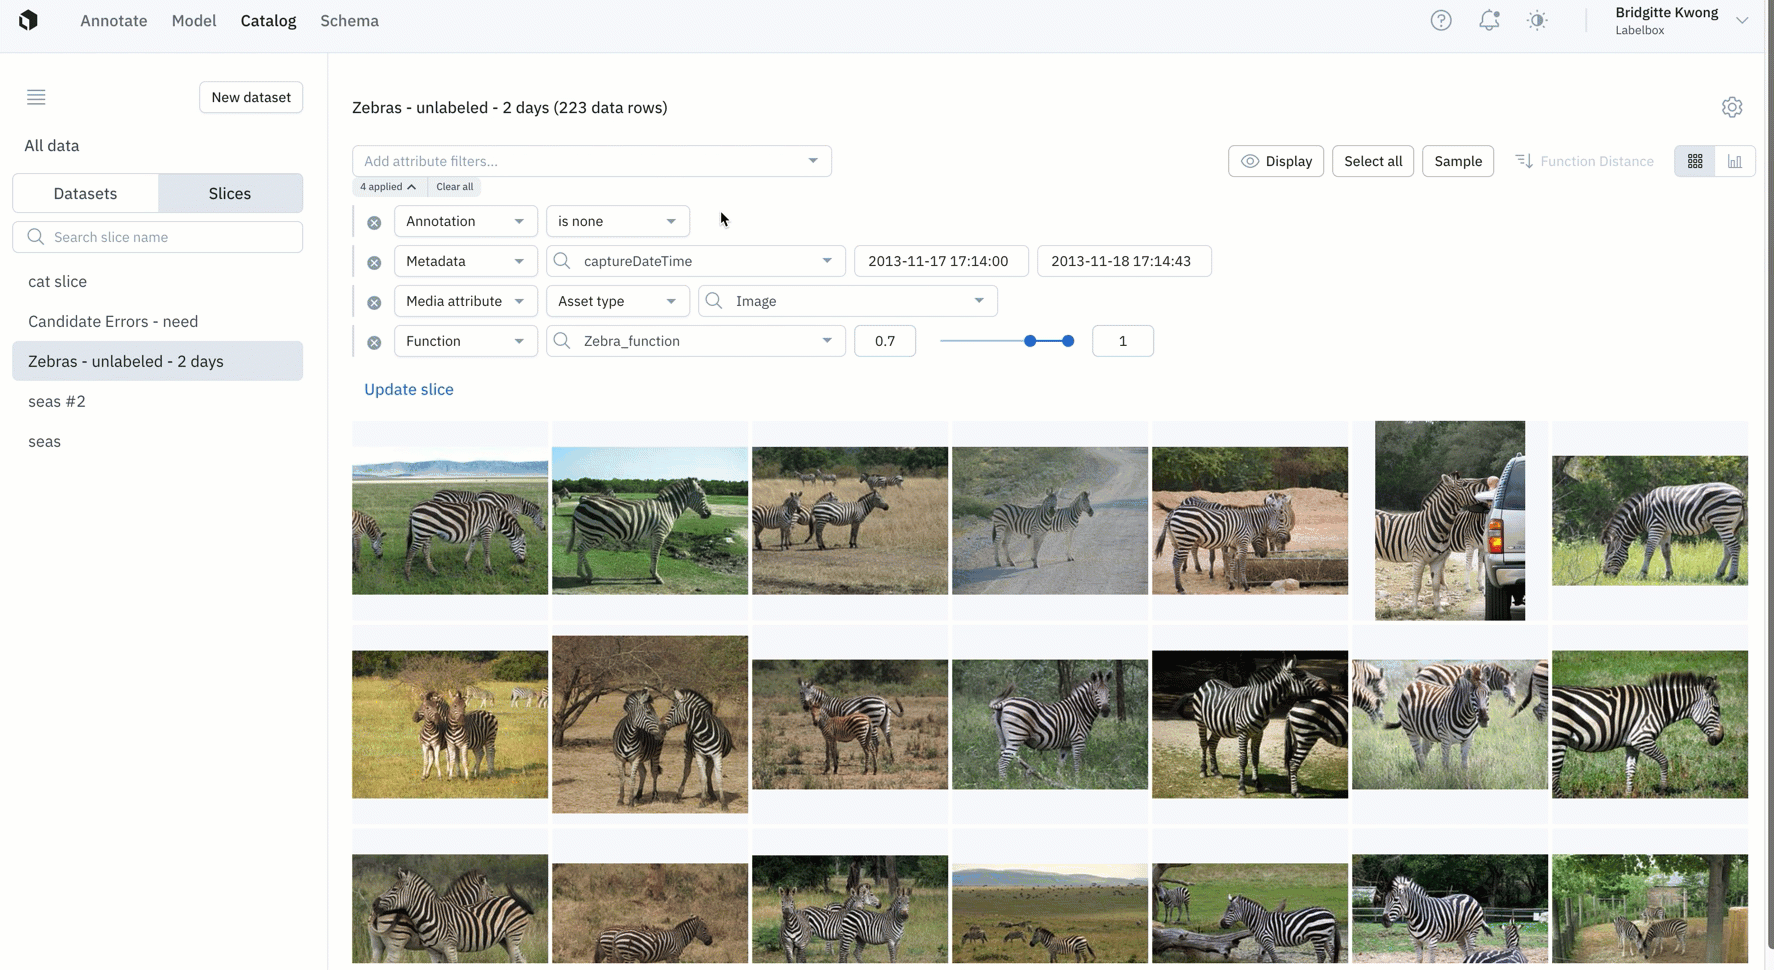
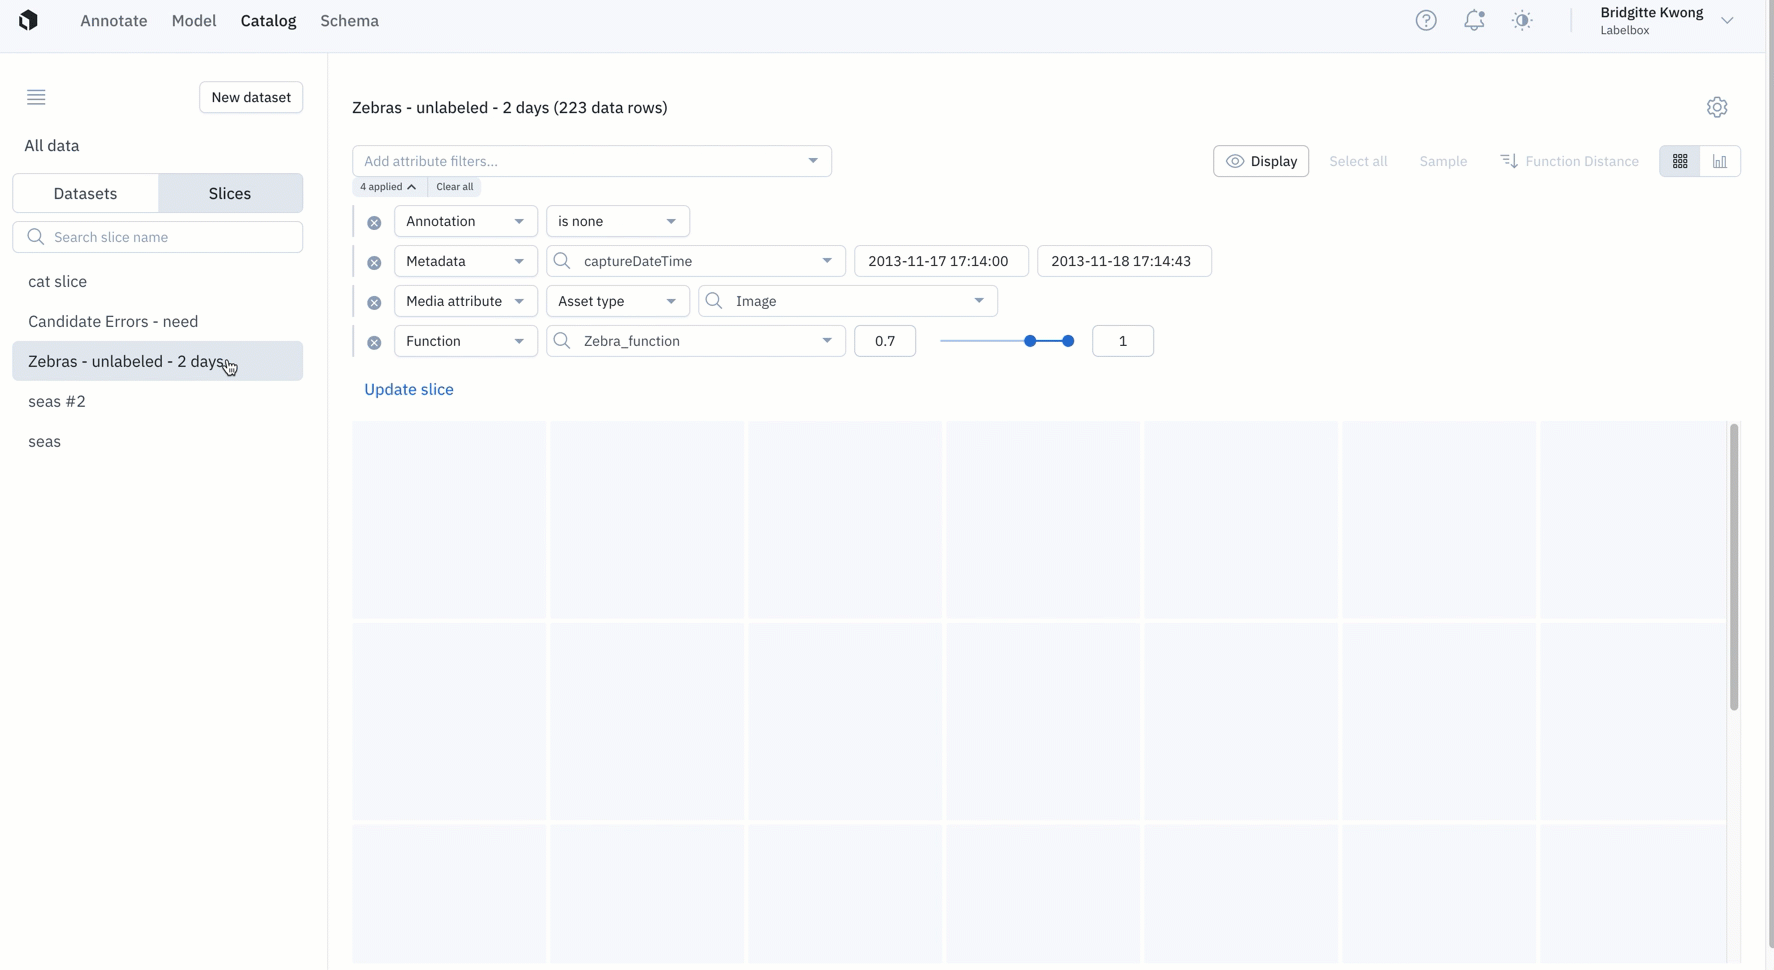
Automate data curation
Rather than sift through all of your data or have to filter data every time you want to surface labels of interest, slices enables you to automatically surface high-impact data.
- Slices are dynamic in that data rows within a slice can change over time depending on if new data rows match the filter or if old data rows no longer match the filter.
- Monitor incoming high-impact data rows populating your slice by routinely checking your slices daily, weekly, or even monthly depending on your use case.
- Slices can help narrow the data that you have to sift through in order to identify data rows of interest. This makes it easier for teams to send high-value or impactful data rows as a batch to a project in priority.
Retrieve data rows from a slice with the SDK
Teams can retrieve data rows and a slice’s information programmatically via the SDK. From there, teams can:
- Inspect all data rows within the saved slice
- Curate a new batch of data rows or sample from a slice directly
- Append data rows to your model runs from your slice
To learn more about slices, refer to our documentation.
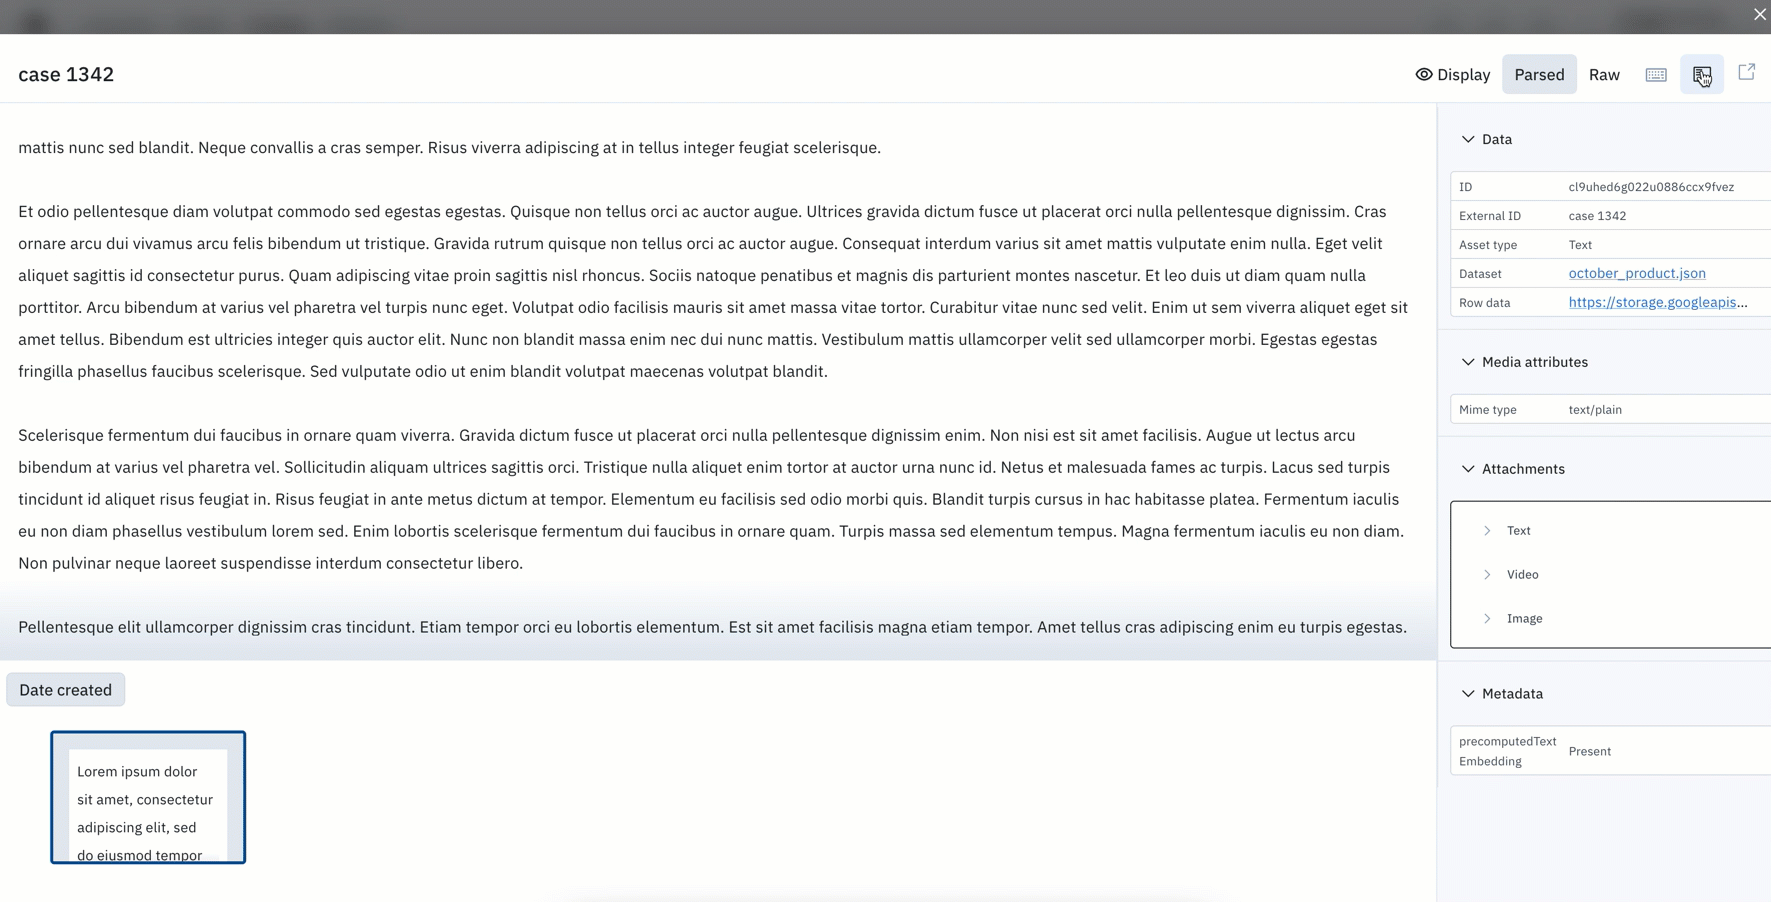
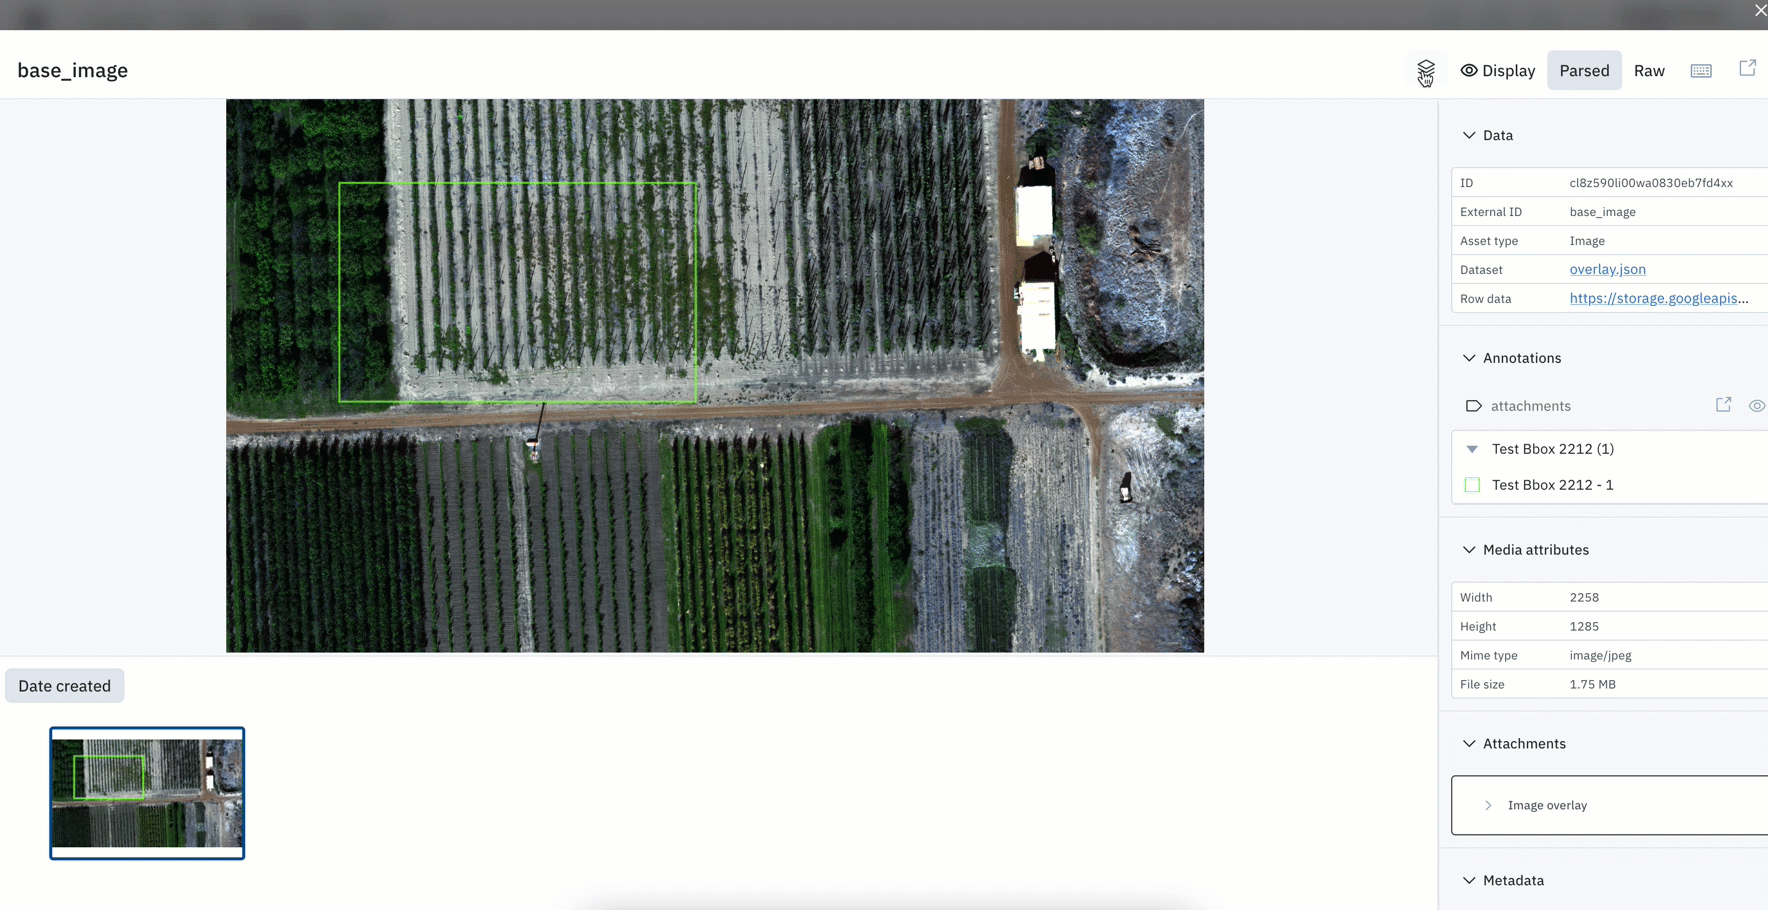
Provide additional context with attachments & image overlays
Context is often important for labelers to better understand the labeling task at hand and to minimize labeling errors. Attachments can be added to an asset to help provide additional context for the labeling team – they can resemble images, video, text, or HTML content and are applied to individual assets.
Similar to attachments visible in the editors, teams can now view attachments and overlays directly in Catalog’s “detailed view”.
- Attachments will appear in their original format. Prior to this update, additional context would be formatted and opened as a raw attachment in a new tab.
- Special characters and videos are also supported and can be displayed directly in Catalog.
- Image layers can help provide contextual layers to the primary image. You can attach additional views or formats (greyscale, thermal, etc.) to help supplement labeling.
Easily identify data row processing issues or errors
Issues with your data rows can cause problems in the downstream process of your labeling operations. High-quality training data is crucial to improve model performance and teams will want to make sure there are no errors with data row processing.
When uploading a dataset to Labelbox, you’ll be able to see the progress and processing status of your data rows.
- During data row processing, Labelbox will extract metadata that can be used to better search and filter across your data rows.
- Once your data rows have been uploaded and processed, you can generate off-the-shelf embeddings for similarity search and projector view, extract media attributes, and convert your data into a standard format.
- With this update, you can better understand how data rows that failed to process are causing disruptions to your labeling workflow and re-process data rows based on any processing issues.
- After processing, the uploading of a data row will result either in the success or failure of a data row upload. You can easily identify which datasets contain processing errors or warnings and can further investigate reasons for not being processed correctly. Datasets that contain issues are indicated by a red dot in Catalog.
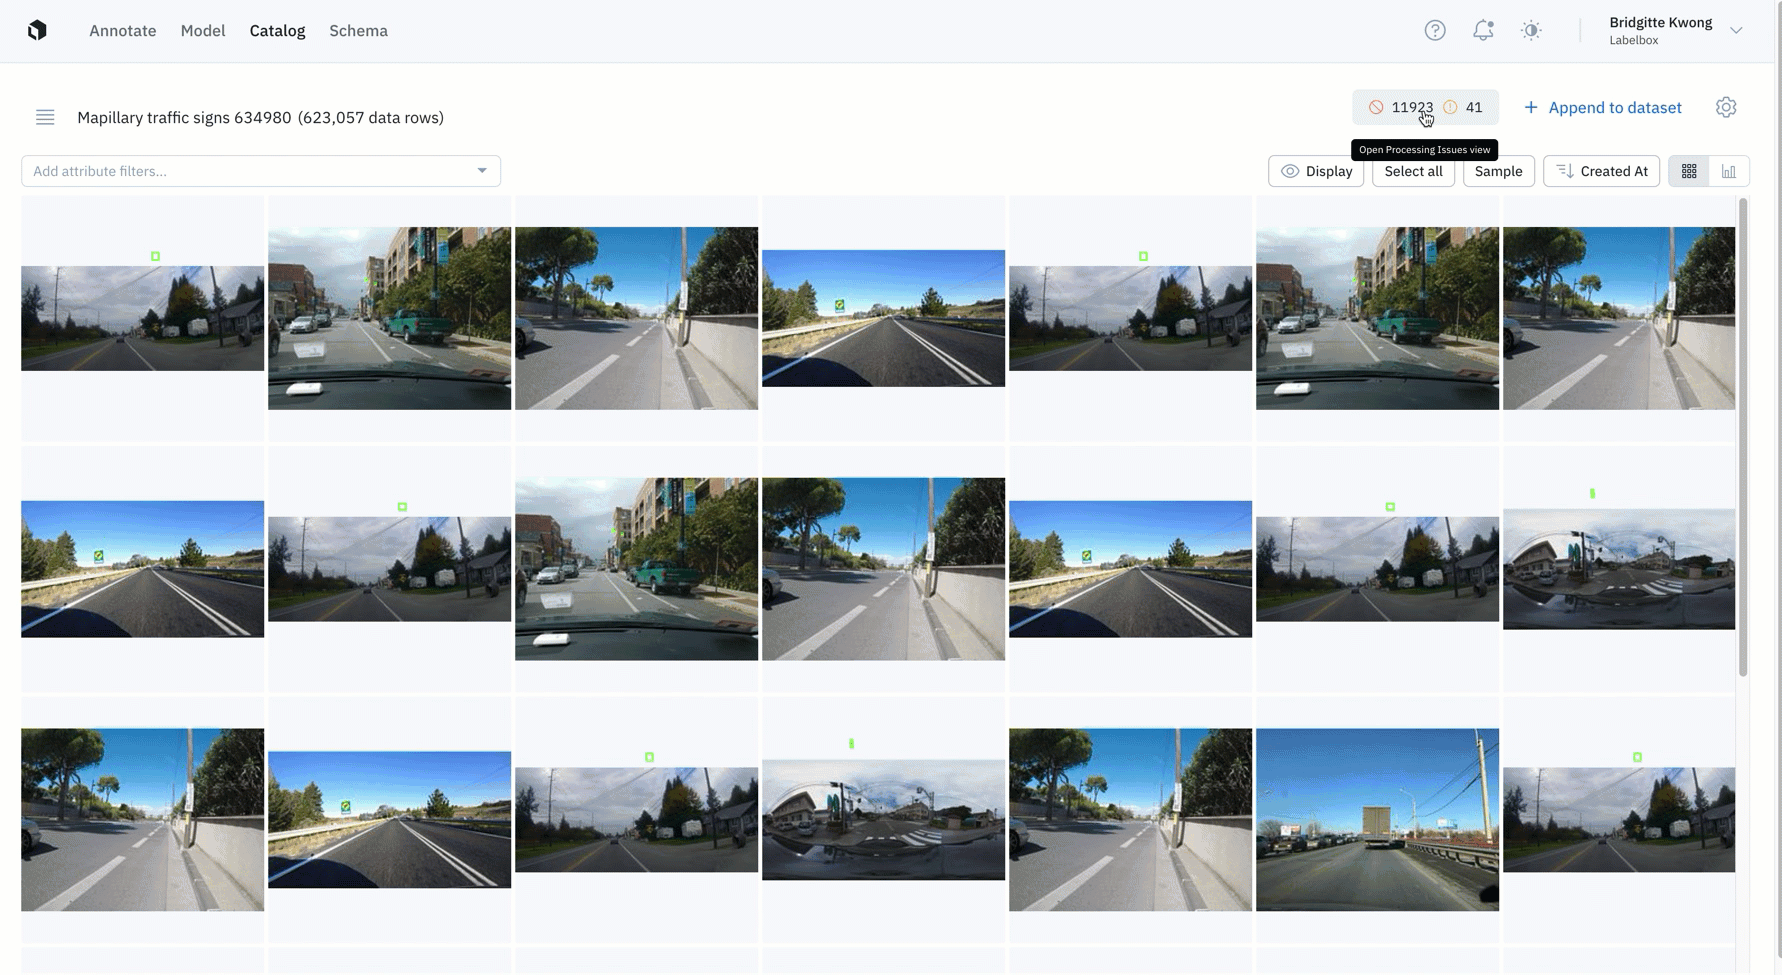
- Errors: We flag errors when the data row contains a serious issue that can undermine a downstream workflow in Labelbox. A data row with an "error" will not show up as a data row in your Catalog dataset.
- Warnings: We flag warnings when the data row contains issues that might affect usage in Labelbox. These data rows can still be used and will show up in your Catalog dataset, but might be downgraded for some features.
- Fixing processing issues: You can fix and reprocess data rows that are flagged with errors or warnings. We’ve provided details on how to remediate errors & warnings that appear in Catalog. You can find the full list of errors, warnings, and recommended user fixes here.
Latest guides on data curation
Check out the latest tutorials & walkthroughs on how to better curate and manage your data in Labelbox:
How to set up delegated access between:
Annotate
Update your ontology by reordering features
Ontologies are a crucial part of any labeling project. Based on new project parameters or learnings, you might want to update or edit an existing ontology.
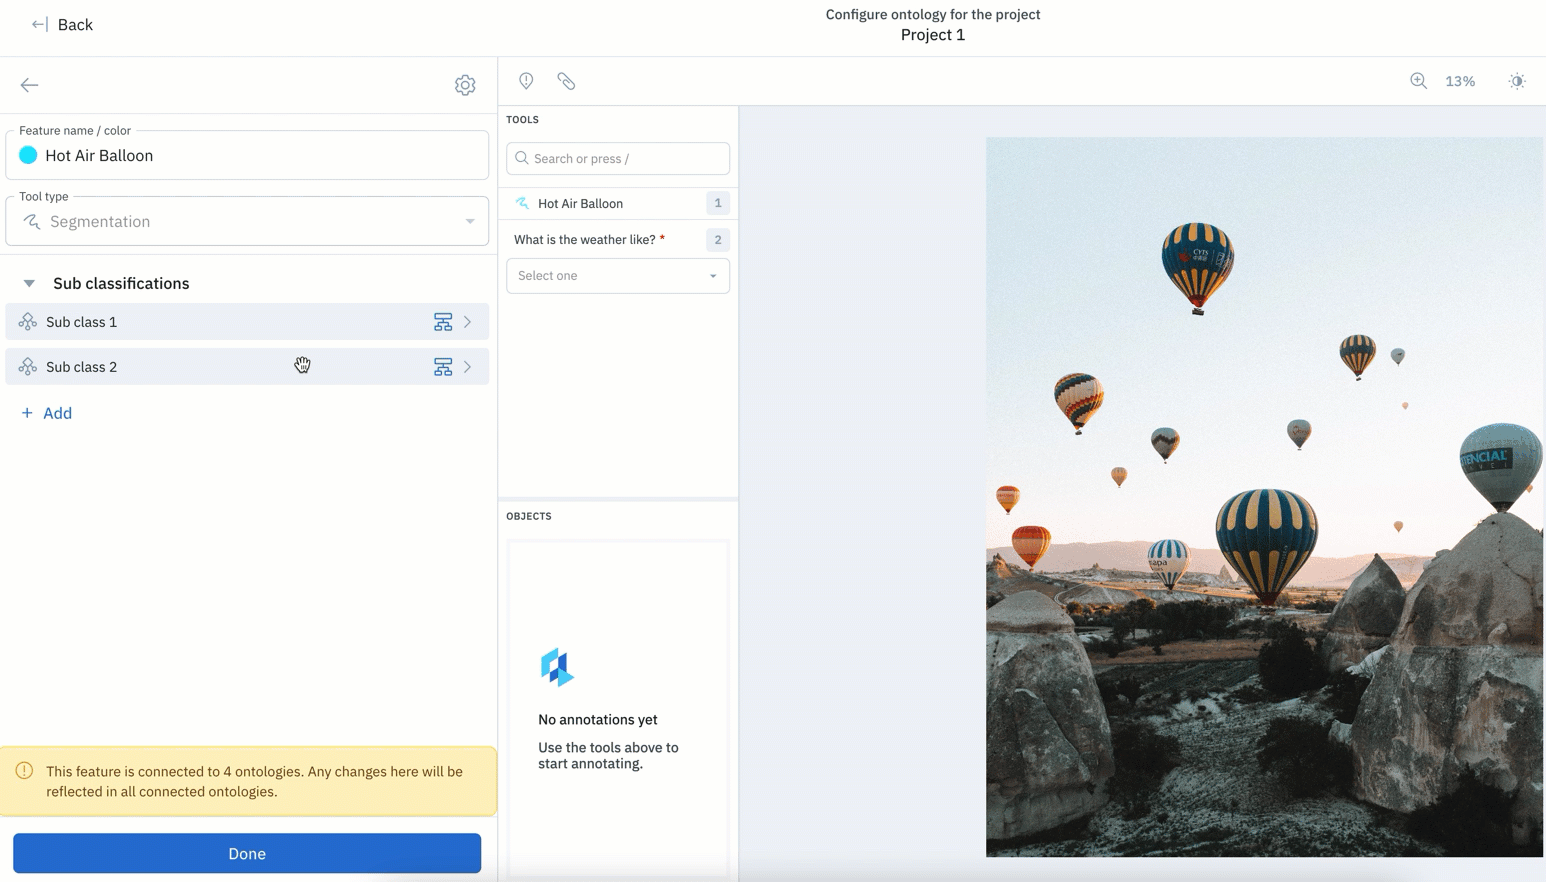
With this update, features in your ontology can be easily reordered.
- Along with being able to edit or remove features, teams can now reorder nested ontology nodes regardless of when they were created.
- Prior to this update, new ontology objects created would appear at the bottom, with no way to re-order your ontology without deleting objects.
- Rather than having to delete objects in order to re-order them, you can easily drag and rearrange objects in their desired order.
Learn more about reordering features in our documentation. You can also check out our latest guide on how to create and manage ontologies.
Pre-labeling support for bounding boxes on PDF documents
The creation of pre-labels through model-assisted labeling (MAL) can dramatically decrease iteration cycles and the overall time taken to reach a performant model. For current beta users of our Document editor, teams can upload bounding box predictions to their documents.
- We now support MAL for bounding boxes on PDF documents – you can now upload a predicted label to a data row in our Document editor.
- Teams can use the following tutorial notebook to get started with MAL or refer to our documentation for more information.
If you’re interested in learning more about our Document editor, check out this guide.
Coming soon: A new way to queue & review data rows
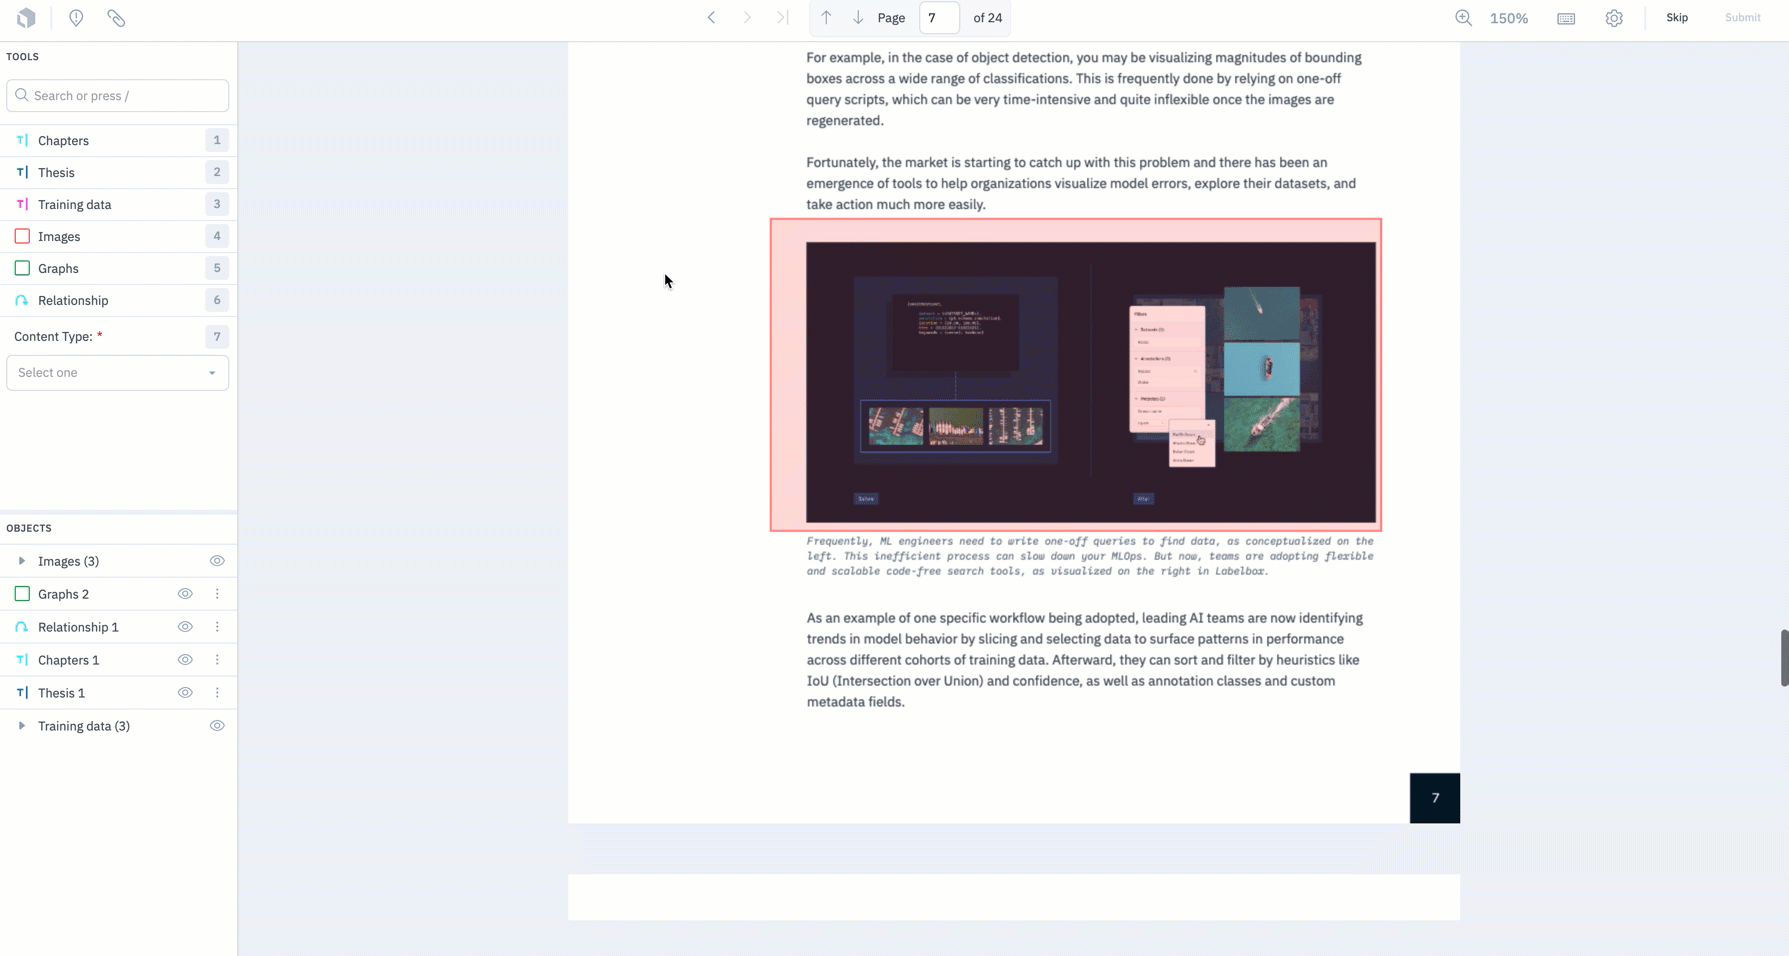
A vital aspect of a data engine involves the creation of large volumes of high-quality training data. Often, AI teams struggle to prioritize the right data to label and end up spending more money on data labeling than they should.
This year, we've released two features – Batches and the Data Rows tab – to help teams better prioritize, queue, and manage their data. Now, we’re excited to introduce a third feature called Workflows.
All three features, batches, the Data Rows tab, and Workflows, work to help teams label data more quickly and efficiently to create high-quality training data, faster.
Labelbox will automatically be configuring new projects with batches, the Data Rows tab, and Workflows. This will be done on a rolling basis according to the timeline below:
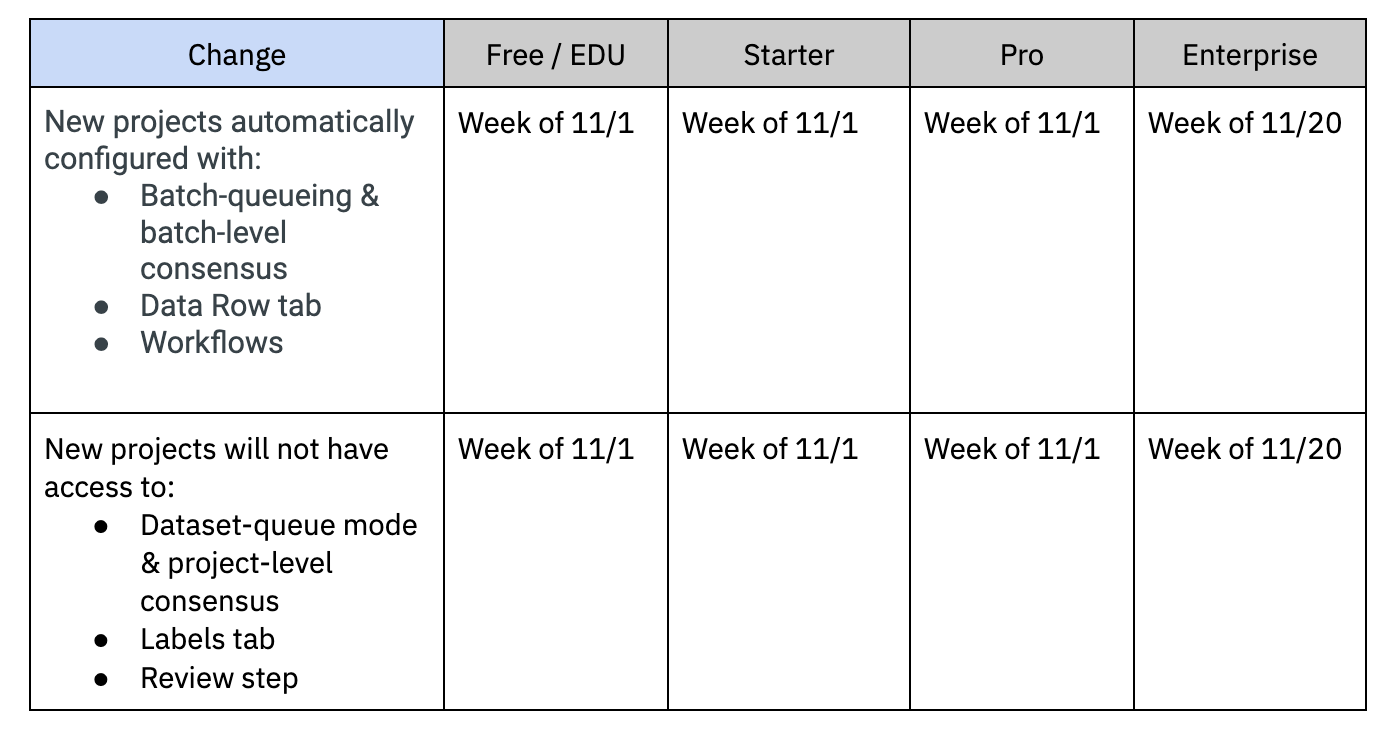
For all new projects after the launch of Workflows, teams will need to use:
- Batches to queue data rows for labeling, configure data row priority, and set the number of labels (if this is a Consensus project)
- The Data Rows tab to manage & view the status of data rows
- [New] Workflows for custom review
We’ll be opening up a migration path for all old projects created before this date, which will be scheduled for 12/20. Stay tuned for more on a detailed migration path.
Learn more about the migration to batch-based queueing, the Data Rows tab, and Workflows in our documentation.
In beta: Capture an object’s directionality with the Cuboid Tool
The Cuboid Tool is now available for teams to use in beta.
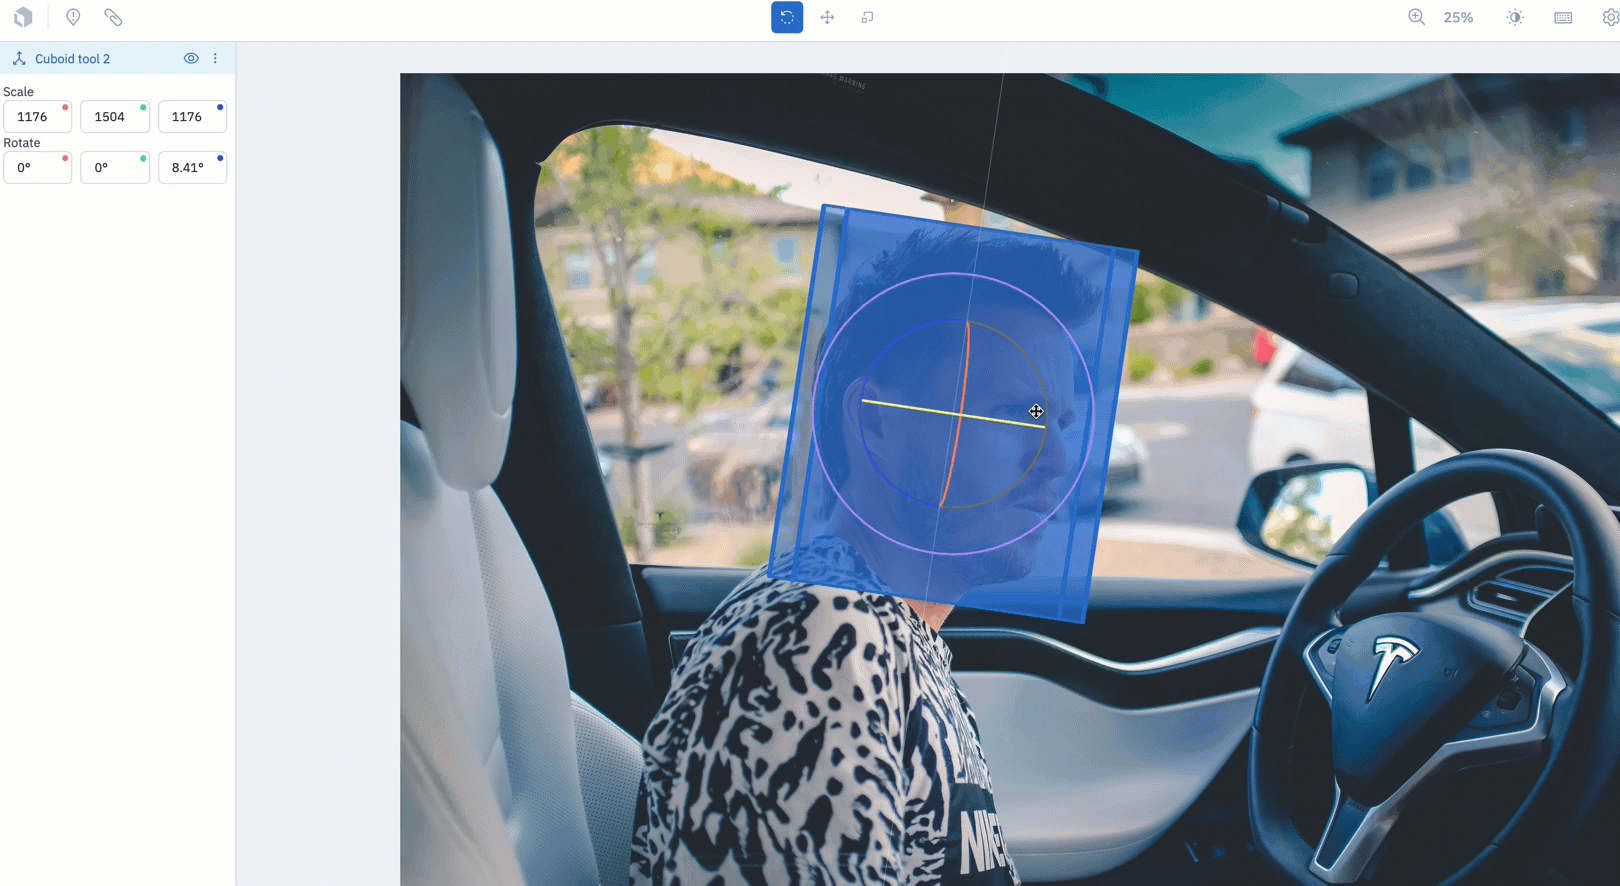
- Teams who are interested in capturing an object’s directionality (up & down, side to side, and left to right) can now create a cuboid by drawing a bounding box over the object of interest.
- To use the Cuboid Tool, create an image project and select "Cuboid" from the object dropdown during ontology creation.
- Draw a bounding box over the object of interest. Once released, the bounding box will automatically become a cuboid.
- There are three modes to rotate, move, or scale the cuboid. Use the levers on the tool to adjust its rotation along the x,y, and z axes.
Learn more about the Cuboid Tool in our documentation.
Latest guides on labeling operations
Check out the latest tutorials & walkthroughs on how to effectively manage your labeling operations:
- How to convert Labelbox exports into COCO format
- How to create and manage features & ontologies
- How to annotate conversational text for chatbot uses cases
- How to natively annotate a PDF document
- Fundamental elements of the Labelbox editor
Model
Better visualize data rows, ground truth, and predictions
Being able to visualize ground truths and predictions allows you to immediately better understand how your model is performing and can help inform and validate hypotheses behind model behavior.
Similar to the panel displayed in Catalog, you now have greater control over how you visualize your data rows as well as annotations and predictions in Model
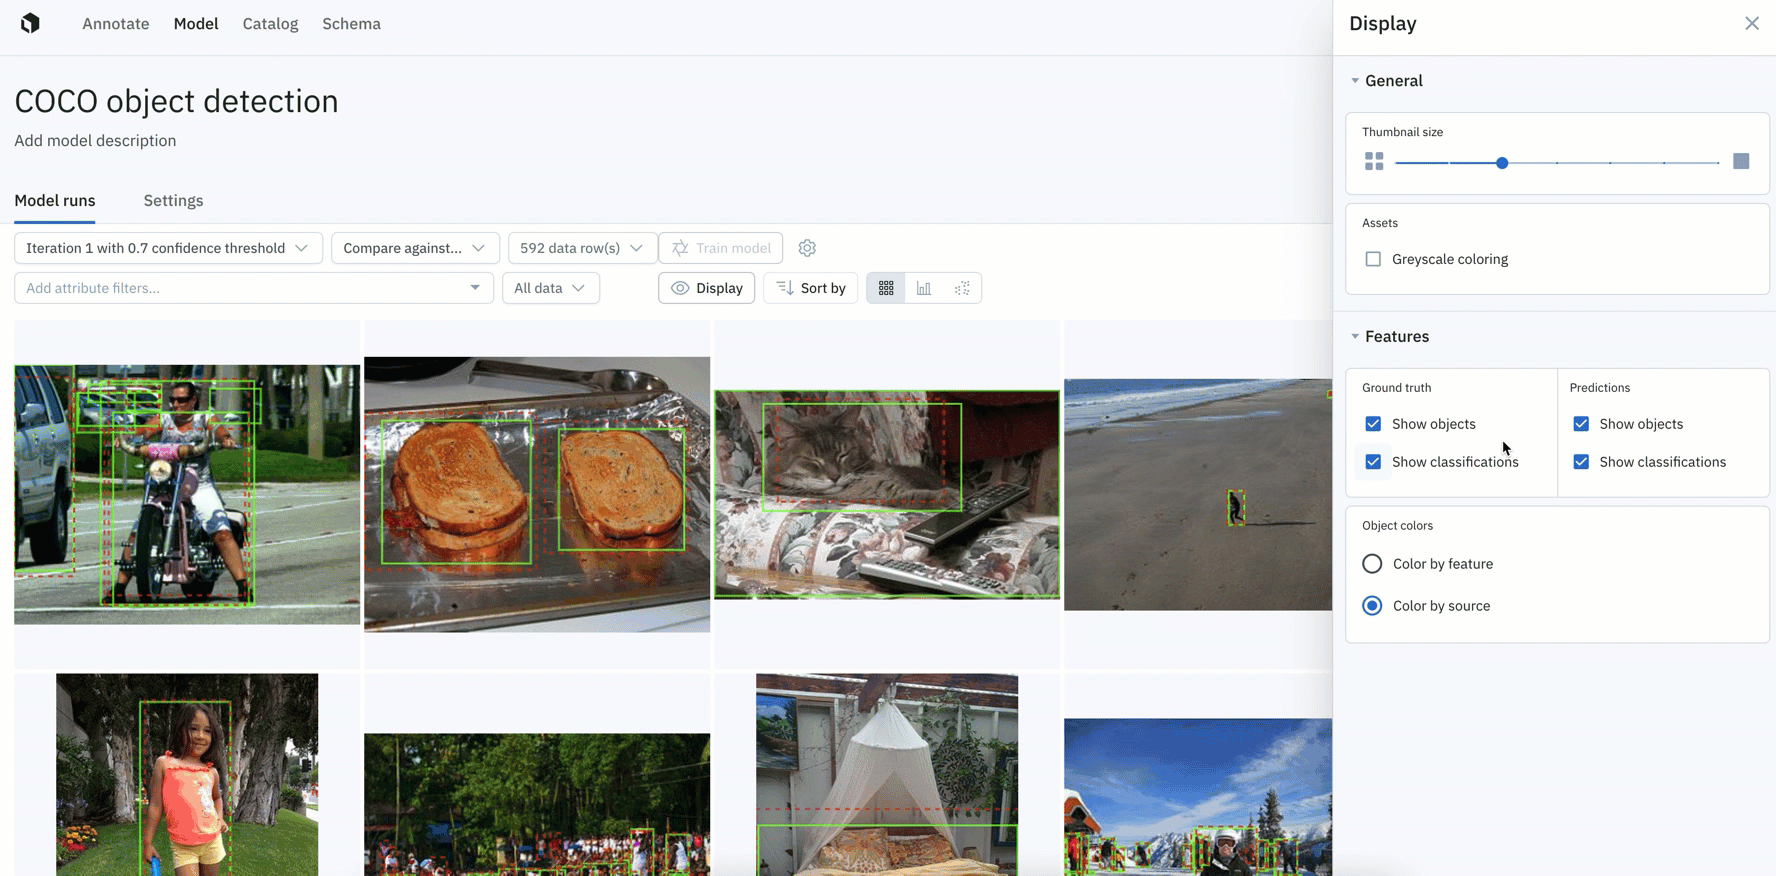
- You can now control the thumbnail size of data rows and adjust the greyscale of images.
- You have more granular control over how ground truths and predictions appear on data rows in Model, with the ability to display ground truth and predictions for objects and classifications.
- You can also color ground truths or predictions by feature or by source.
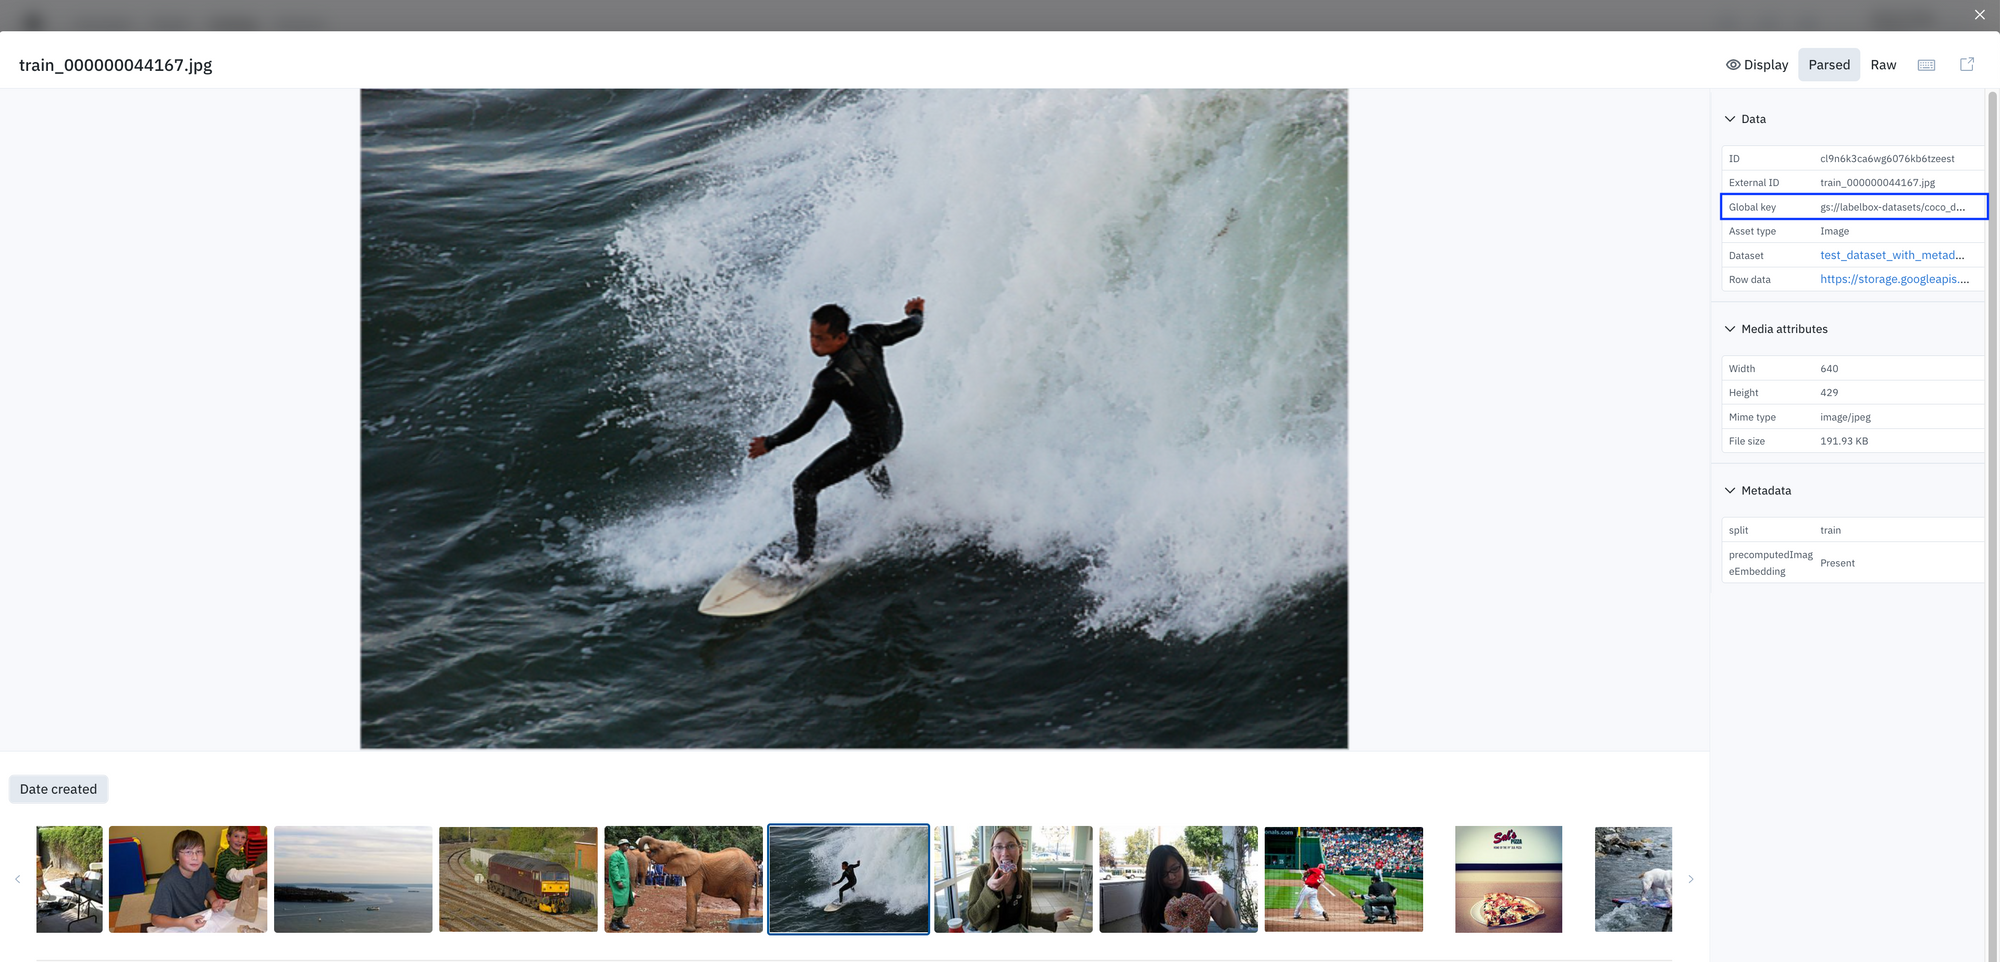
Search for and find data rows faster with global keys
Last month, we introduced global keys — new user-specified IDs for your data rows, which can be easily assigned either retroactively or upon creation.
Mapping only to exactly one asset, global keys help prevent duplicate data uploads and enable faster querying. You can learn more global keys in last month’s product update.
Teams can now:
- View their global key in “detailed view” across Catalog, Annotate, and Model.
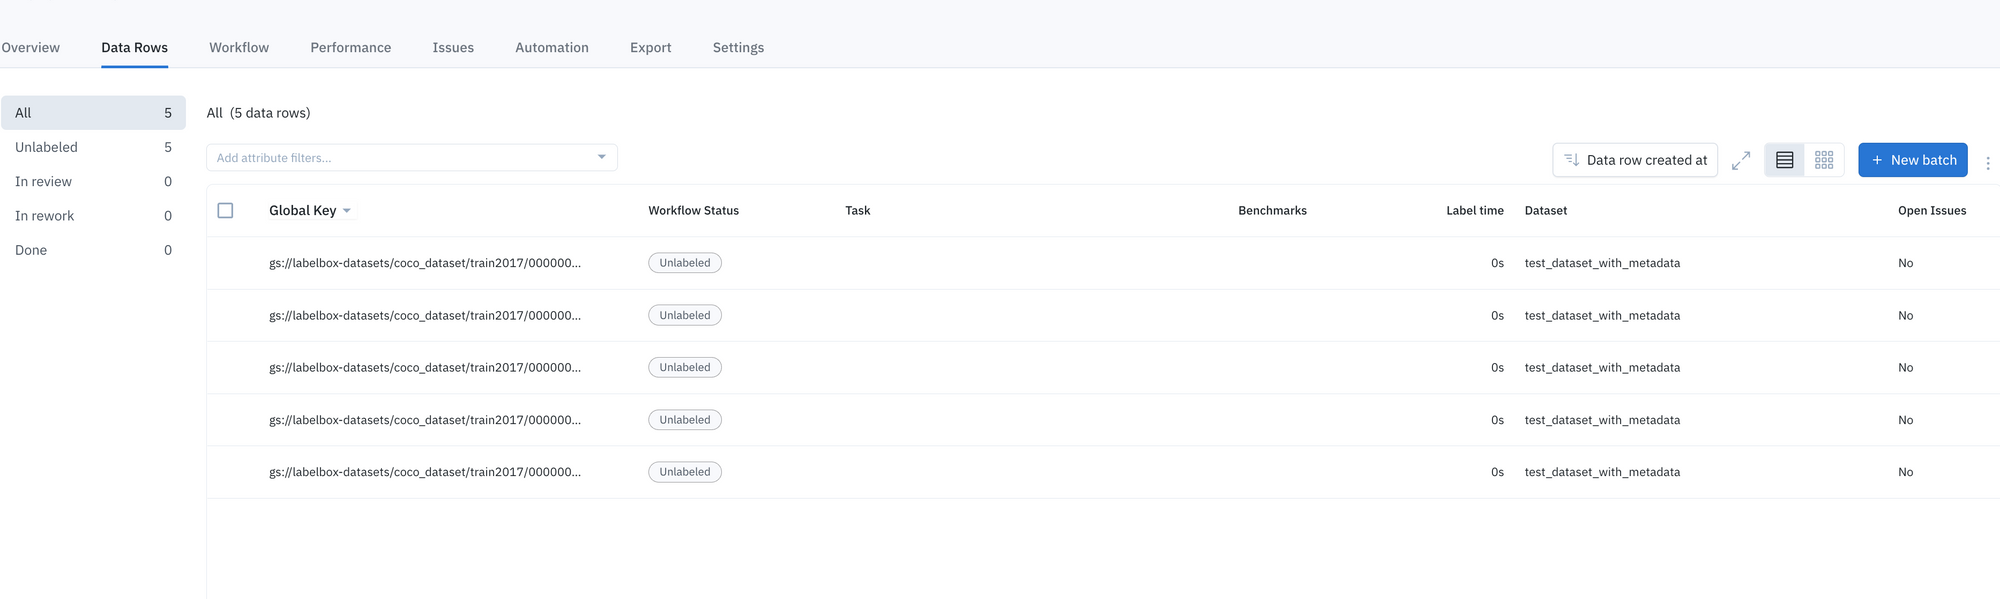
- In Annotate, you can select global keys as a column to view your data rows in the Data Rows tab.
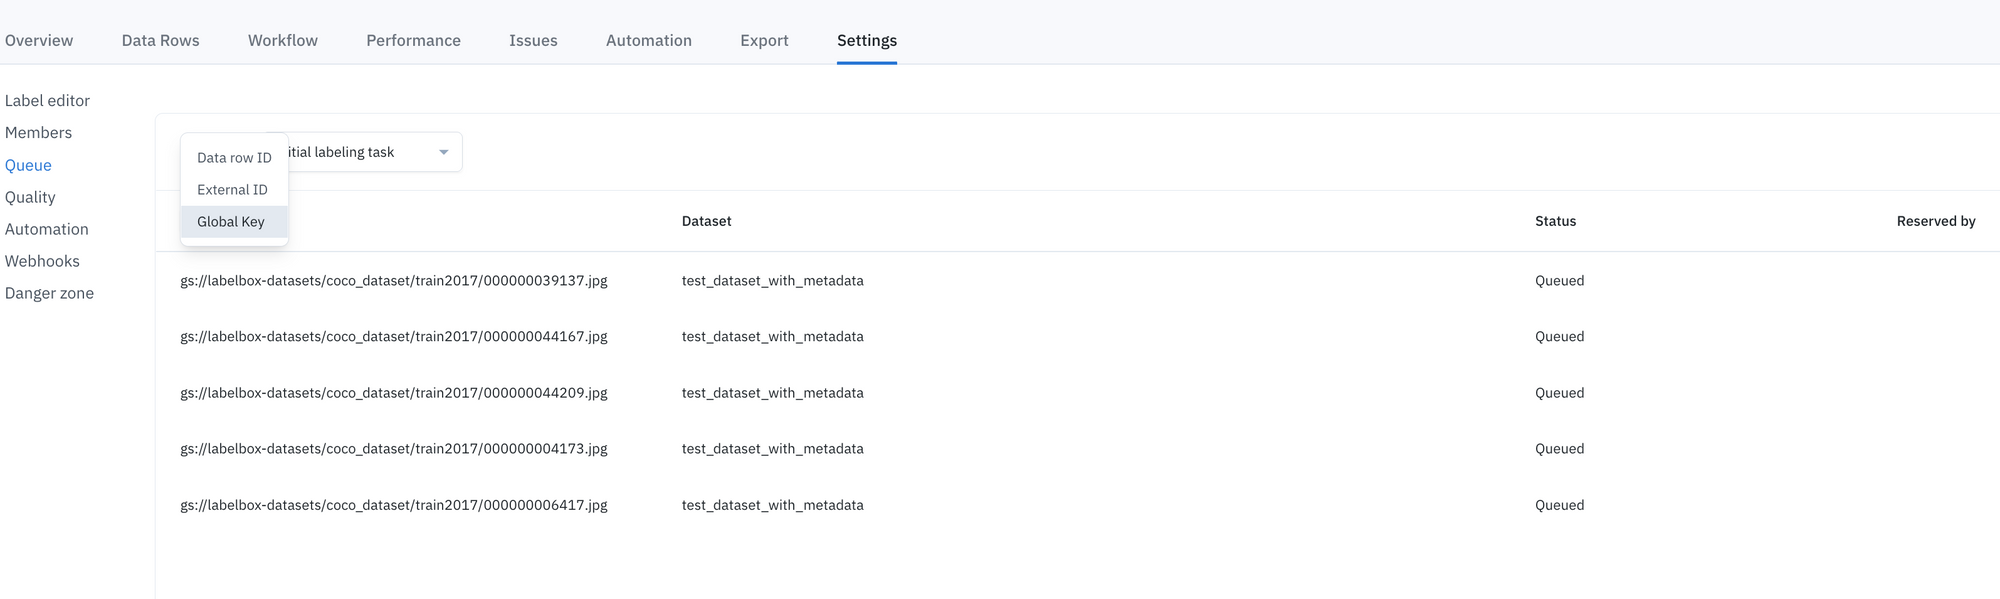
- In Annotate’s “queue view”, you can now select global keys as a column to display and view your data.
Latest guides on model improvement & model training
Check out the latest tutorials & walkthroughs on how to accelerate model performance:


