All blog posts
Labelbox•September 27, 2024
Monitor and optimize: Boosting data quality with new Labelbox workspace Monitor
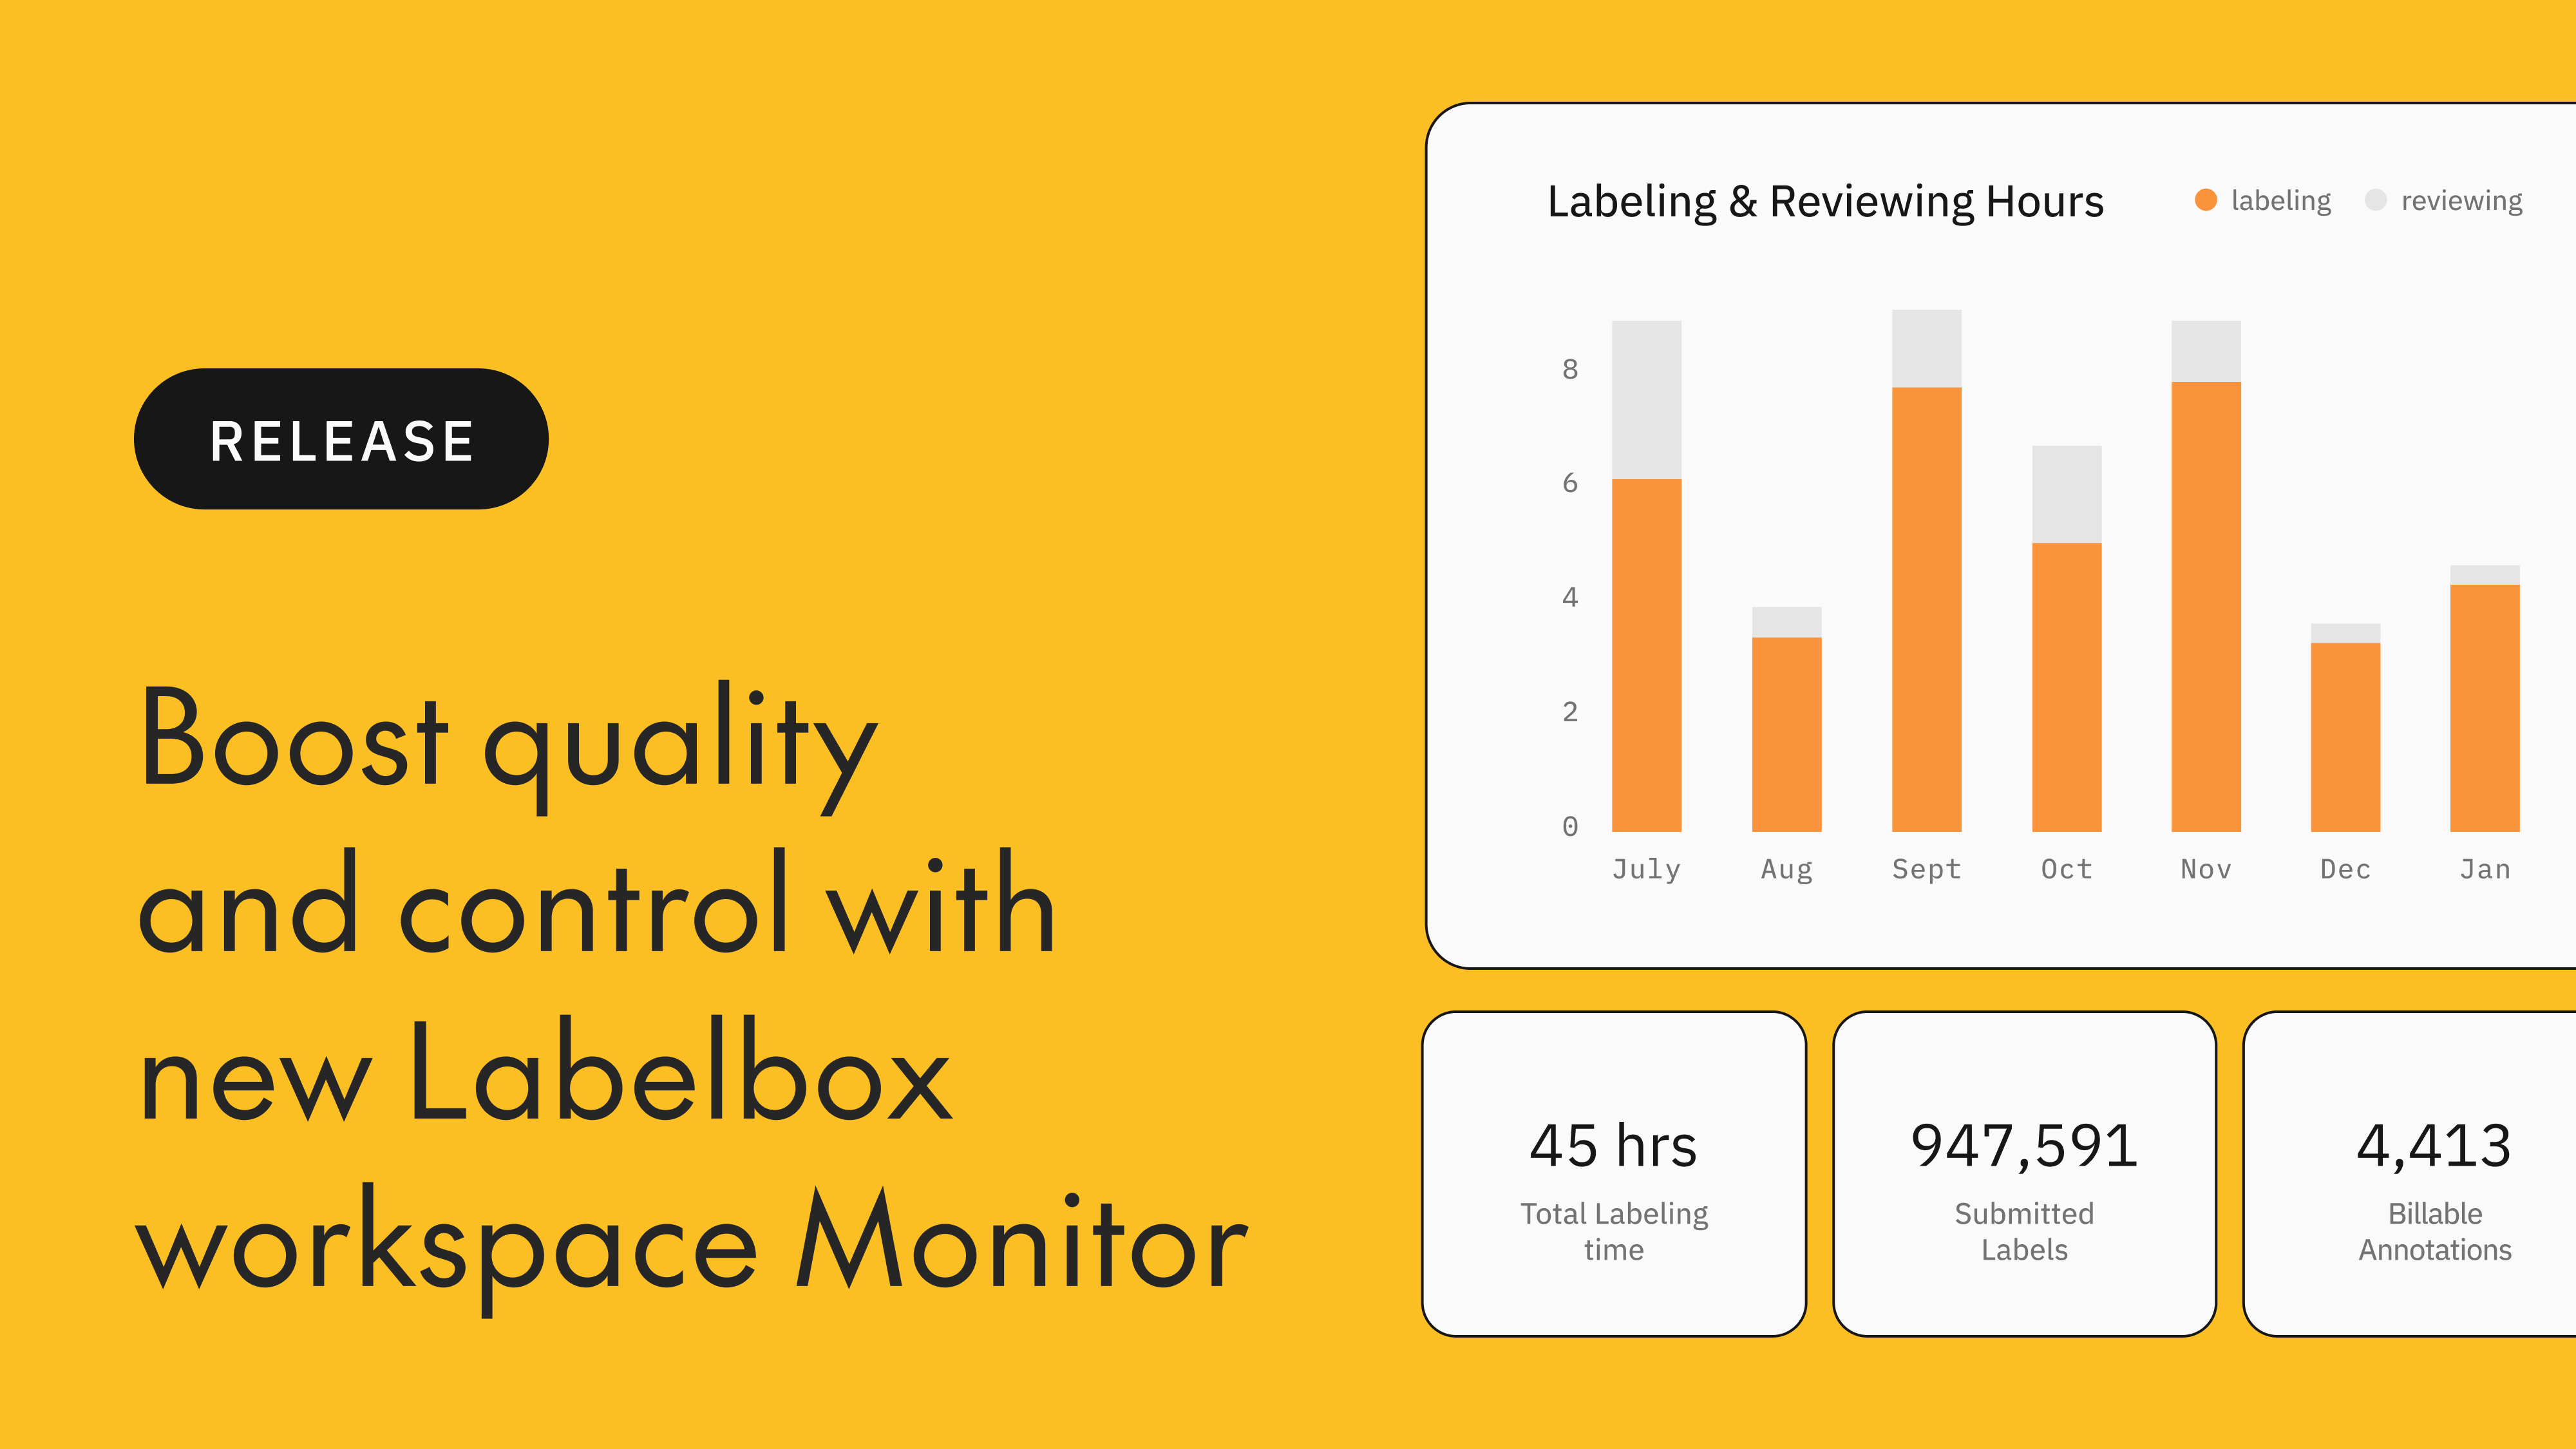
In the world of generative AI, high-quality data is the foundation of success. Today, we're excited to introduce Labelbox Monitor, a powerful visualization and reporting tool in the Labelbox platform to help your data labeling operations consistently deliver top-tier quality.
Available to all enterprise customers, this highly-requested feature adds a centralized dashboard conveniently located on the homepage of the Labelbox platform. With one-click, you can access comprehensive metrics of all of your projects and labelers within a workspace in an intuitive user interface, allowing you to monitor and optimize efficiency and quality like never before.

Enhancing data quality with granular monitoring
With comprehensive and customizable visuals of your workspace projects and labelers, Monitor delivers key benefits around quality, management, and monitoring. The new solutions is designed to help you:
- Enhance data quality: Pinpoint outliers, such as underperforming labelers, or quickly identify poorly crafted workflows and take corrective action to maintain the highest standards.
- Monitor overall performance: Track progress, identify bottlenecks, and ensure deadlines are met across all projects with a bird’s-eye view of your entire workspace.
- Make data-driven decisions: Visualize trends with interactive charts and graphs to gain insights into labeling throughput, annotation activity, review actions, and more.
- Simplify management: Perform bulk actions, manage roles, and communicate with your team effortlessly.
- Assess individual contributions: Quickly identify top performers and those who may need additional support, streamlining your team management.
Meet the new features of Labelbox Monitor
Monitor’s user interface is split into three logical areas:
- Project performance: Visualize cumulative data for each project with flexible, filterable charts.
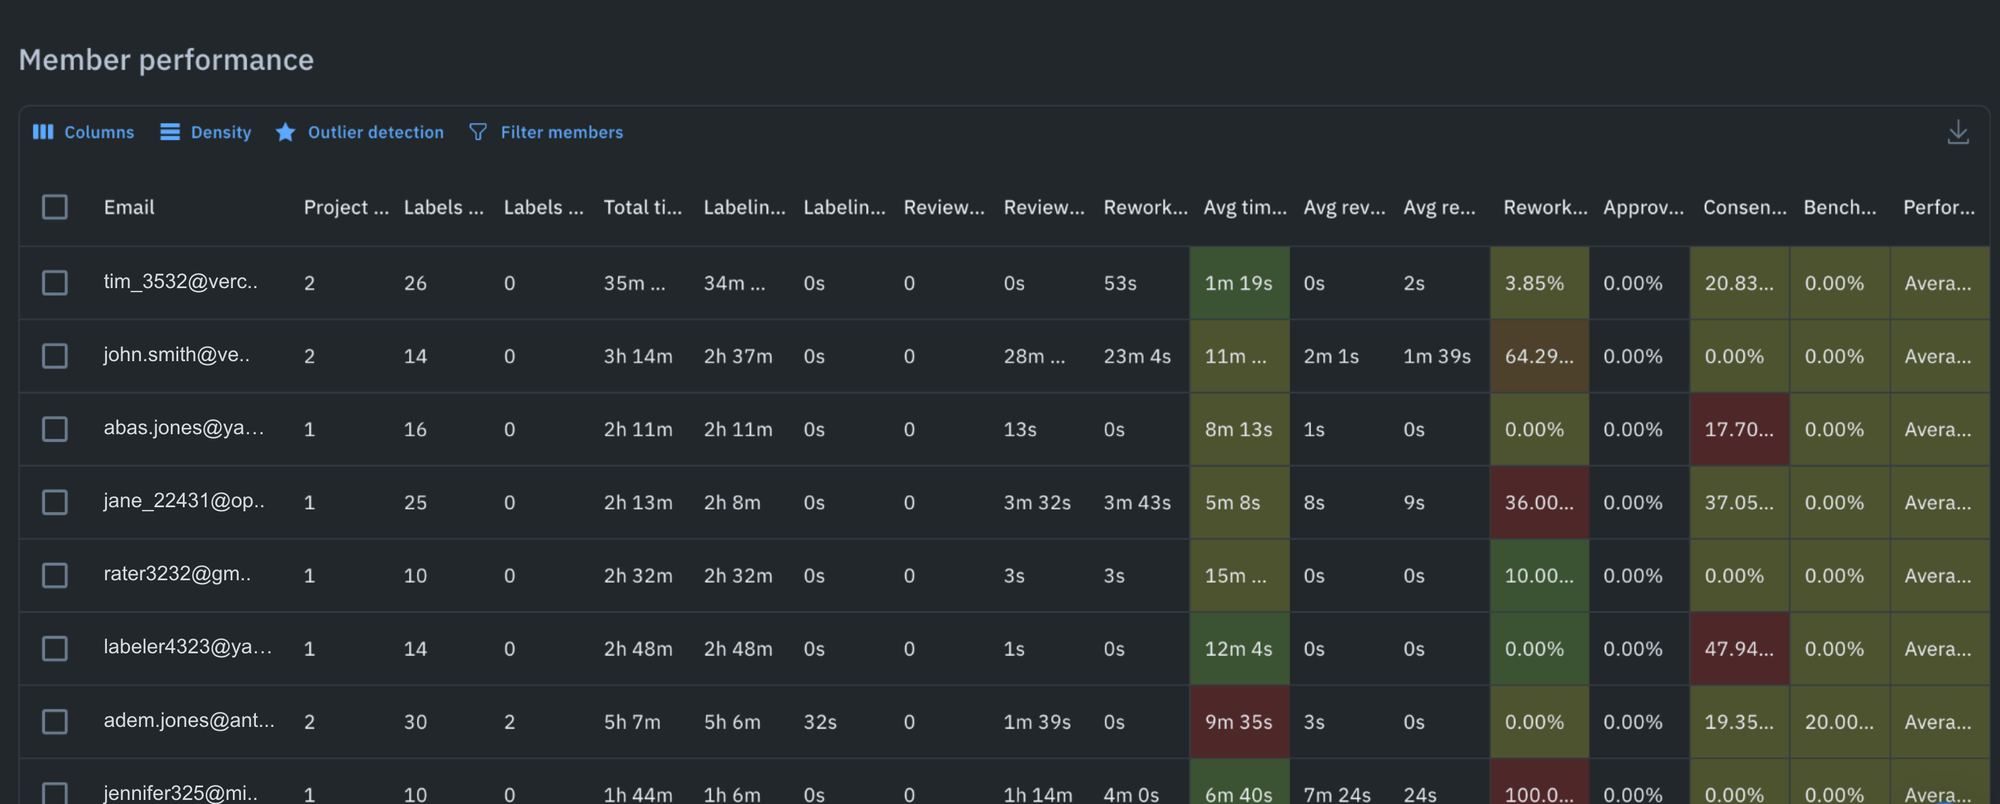
- Labeler performance: Assess individual labeler performance across all projects within your workspace.
- Performance charts: Dynamically visualize data based on selected filters and analyze statistical data to identify outliers.
Within the dashboard, you will find a number of features to help you maintain a real-time, comprehensive view of your labeling operations and perform key operations. All available right at your fingertips; no more jumping between projects or struggling to consolidate data.
The new dashboards delivers these key capabilities:
- Modern UI with real-time analytics: The intuitive interface makes it easy to monitor key metrics and apply detailed filters to pull out the most important data. Throughput and efficiency data is provided on labels, reviews, reworks, consensus and benchmarks.

Filters to identify outliers: Identify outliers for all kinds of labeling tasks by looking at labelers who are multiple sigma away from the mean on labeling and review time. New filters allow admins to perform range filtering using sliders for labeling and review time, with ticks for mean value along with min and max.

- Workspace level monitor: Access a workspace-level monitor page visible to admins with permissions available to custom roles. This brings the same charts and user experience as in the project-level tab, allowing admins to see project-level information without needing to go inside the project.
- Bulk select and role change actions with email notifications: Based on decisions made from the Monitor information, admins can now perform bulk actions from the Performance tab for project-specific changes. Actions include removing labelers from a project or changing roles from labelers to reviewers. These actions trigger email notifications, ensuring transparency and effective communication.
With these new capabilities and flexible visuals, Monitor lets you:
- Monitor and assess the progress of data labeling projects
- Visually understand labeling throughput over time with customizable graphs
- Monitor the volume of annotation activity and assess productivity trends
- Monitor review actions taken on labels and assess the quality control process
- Track total time spent across all projects to identify trends or areas for improvement
- Monitor average label time across all projects
- Assess average agreement scores of labels created in a selected period
By integrating these advanced features into one platform, Monitor transforms how you manage data quality. Whether overseeing multiple projects or fine-tuning your workforce, this tool provides the insights needed to drive efficiency and excellence.
Get Started Today
Ready to unleash the power of workspace-level analytics? Monitor is available to all enterprise customers. Simply login to Labelbox and navigate to the new Monitor tab in your Labelbox platform homepage to get started.
Only have a few minutes? Take a rapid tour of Monitor in this quick, click-through demo.
We're confident that Monitor will help transform the way you manage your data labeling operations. Try it out today and see the difference for yourself! Have questions shoot us a quick note on our contact us page.