
 All blog posts
Labelbox•November 10, 2021
Stop labeling data blindly

One of the hardest questions for ML teams to answer is often “what data will improve model performance fastest?” In data-centric AI systems, improving the quality of your training data is the most important, and most challenging, objective leading to performant models. While the cost of labeling data is largely commoditized, teams can gain dramatic competitive advantages through how they identify model errors, track performance across iterations, and prioritize the type of data needed to improve performance faster so they can ultimately save time and cost through labeling less data.
To help teams iterate faster and more efficiently, we’ve outlined best practices for improving data-centric AI systems. Through adopting these best practices, teams can iterate on their models faster and focus more resources on building IP instead of labeling low-impact data.
Leverage a streamlined process to track model iteration
ML teams need to track and understand model performance so they can make well-informed decisions about how to improve their training data. Today, many teams combine a patchwork of tools and workflows to measure and track model performance. Oftentimes, ML engineers are measuring model performance across scattered notebooks and then sharing results with their team via email or chat. Manually measuring performance this way complicates reproducing results, limits detailed diagnostics, and makes it harder to track how changes in data influence performance improvements. Without a centralized process and system of record, details behind changes in model performance across iterations are more likely to get lost in email threads with teams unable to reliably reference the latest information or see the complete picture.
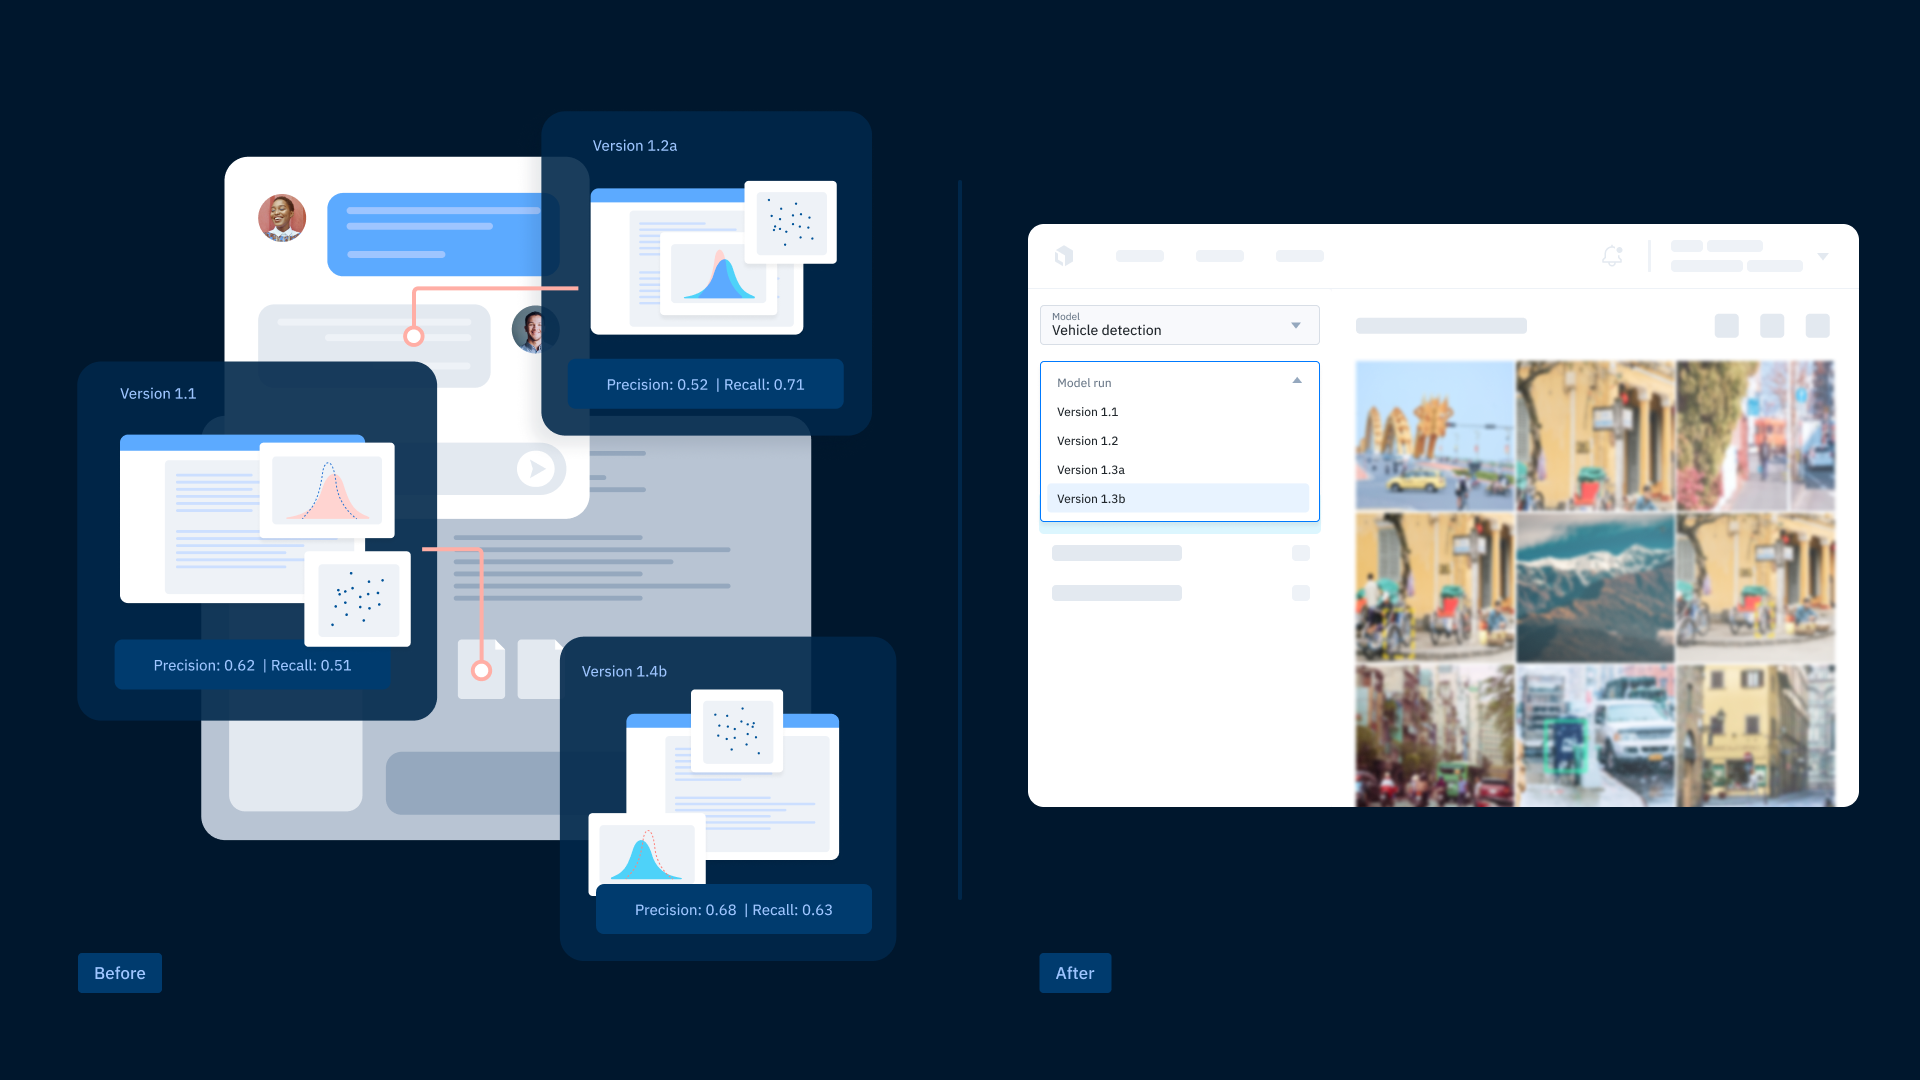
Visualize model performance directly on your data
However you decide to centralize your process for evaluating and tracking model performance, it’s essential that teams can easily visualize model predictions and trends across different slices of data and iterative model runs. Teams can get a more detailed understanding of how their model interacts with data when they can quickly look at model predictions alongside human-generated ground truth labels. This is most often accomplished by manually generating predictions and loading a random set of assets to inspect in a notebook, but it’s hard to make sure that selection is representative of your data, and it’s inaccessible for less technical team members.

It’s important to be able to quickly measure key metrics across different slices of your data to understand variations in model performance and uncover more trends in your data. By visualizing model predictions alongside ground truth annotations, you can put performance improvements into real-world terms that are more meaningful than only looking at changes in performance metrics like loss, recall, or IoU.
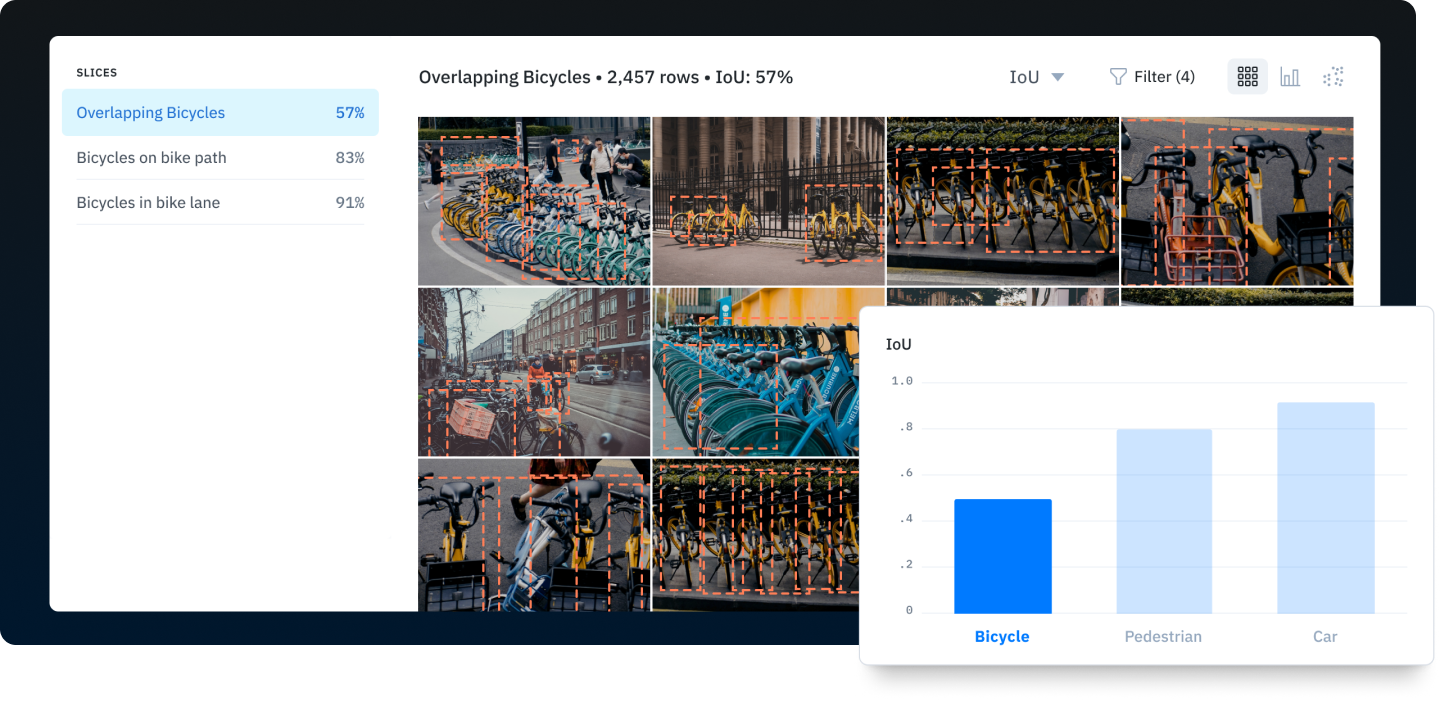
Create a process for quickly finding edge cases in your data
Improving model performance of data-centric AI relies on efficiently identifying edge cases to better prioritize training data initiatives. Using model performance metrics is a common first step in finding examples of edge cases, but these metrics can often obscure more nuanced edge cases. Simply sorting by IoU or other metrics can be helpful but is still limited in its ability to surface insights.
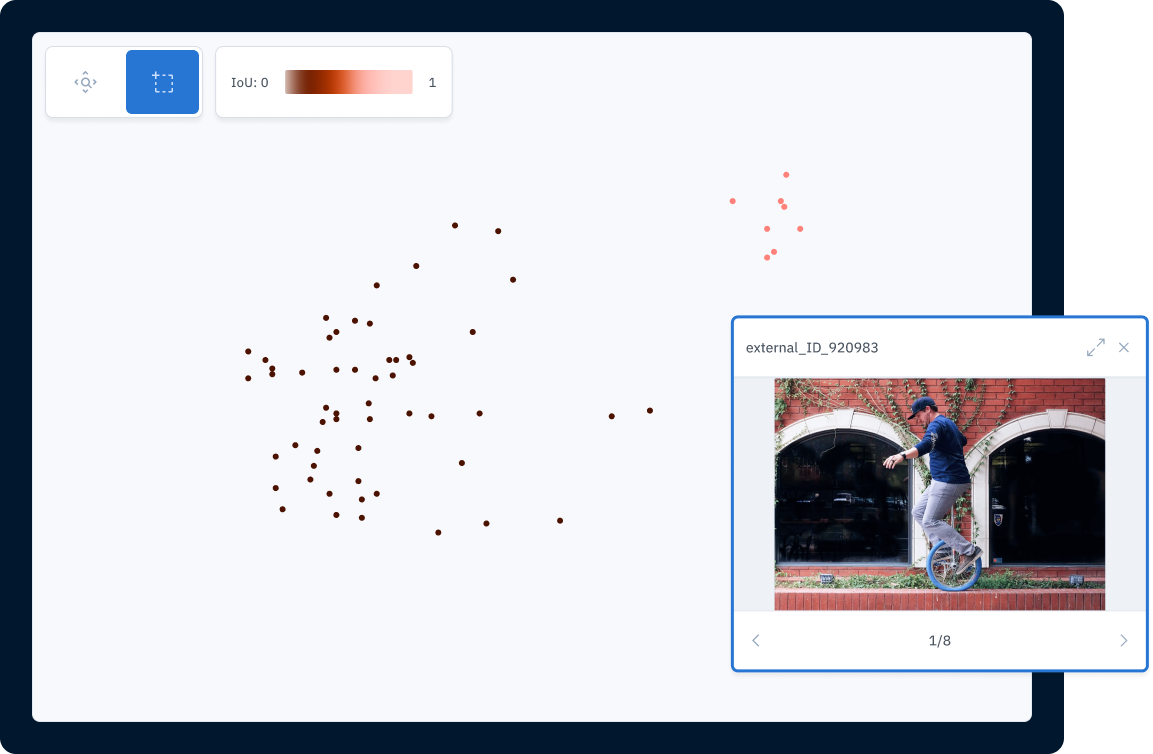
A more powerful way to uncover edge cases is to leverage model embeddings so you can visualize trends in your data, identify similar data, and inspect outliers. Embeddings let you display your data in 2D space and cluster visually similar data so you can better understand trends in model performance and data distribution. Combined with a way to quickly filter data based on annotation type, model performance metrics, or other metadata, embeddings can offer your team a way to quickly identify edge cases in your data where your model needs more targeted improvement.
Label as little data as possible, as often as possible
Most teams start labeling projects by amassing large datasets and sending them to a labeling team without first assessing how their model performs against different types of data and which data may more significantly improve model performance. Many times, even though these datasets may contain a “random” sampling of data from your domain, these aren’t representative of real-world data, don’t effectively capture edge cases, or are negatively impacted by class imbalances. As teams add more data to their labeling pipeline, class imbalances can quickly manifest in your model, and performance can vary wildly across classes.
Rather than submitting large datasets to the labeling pipeline all at once, start by evaluating where your model has sufficient performance, where its performance needs targeted improvement, and make a more informed decision about the data you submit for labeling. Universally, ML teams despise labeling data that doesn’t contribute to building intellectual property and competitive advantage. By visualizing model predictions on a dataset before labeling, your team can identify and prioritize data where performance is lowest. To take it a step further, use model embeddings to find additional similar data from across all of your datasets so you don’t need to worry about coming through vast amounts of data manually just to find more high-impact examples.
Perfect the iteration loop
Labelbox built an end-to-end workflow designed to help teams accelerate model iteration and spend less time labeling data that doesn’t have a meaningful impact on model accuracy. Centralize the tools you need to diagnose model performance, maintain a system of record across model iterations, and prioritize the most valuable data for labeling. Rather than attaching large datasets with a random sample of data that takes days or weeks to label, use:
- Model Diagnostics to identify edge cases and areas of lower performance
- Catalog to find and prioritize the most impactful data for labeling
- Model-assisted labeling to save time by pre-labeling data with your own model
By adopting these best practices, teams will be able to more consistently measure, document, and improve model performance while spending less time and fewer resources on labeling data that doesn’t strengthen their model and build IP. Sign up for a demo to learn more about active learning and how Model Diagnostics and Catalog can help your team.


