×![]()

 All blog posts
Labelbox•September 13, 2021
How to get the most out of your labeling operations

More often than not, AI and ML teams prioritize iterating on the algorithm itself over optimizing the (usually more mundane) process of creating and refining training data. During our time supporting hundreds of ML teams, however, we've come to learn that those who monitor and improve their labeling operations realize significant savings in time and costs, and are often better positioned to accurately estimate future requirements for their projects.
Our recent webinar, led by Labelbox Co-founder and COO Brian Rieger and Sr. Product Manager David Liang, focused on three categories of metrics that ML teams can use to optimize their labeling process, and how a training data platform like Labelbox can help track them. These metrics were inspired by those used by manufacturers around the world to monitor their operations: throughput, efficiency, and quality. When labeling operations teams commit to creating a balance between these categories — ensuring that throughput isn’t soaring at the detriment of data quality, for example — the process becomes truly optimized.
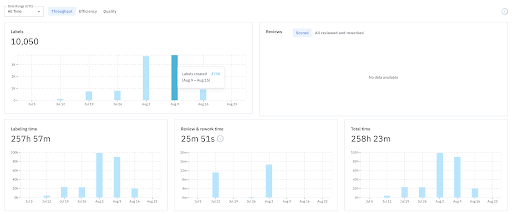
Throughput
Throughput is the total amount of training data produced in a given time period. Throughput metrics to watch include:
- Labeling and reviewing throughput. Teams should take into account both labeling and review throughput to gain a more accurate understanding of the process, monitoring potential bottlenecks in the review process.
- Time spent labeling and reviewing. This metric is used to calculate the costs of a labeling operation, and if it remains consistent, can be used to project future costs as well.
- Per labeler throughput. This metric can help teams pinpoint low and high performing labelers.
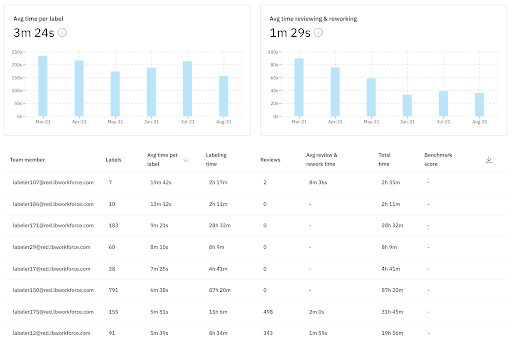
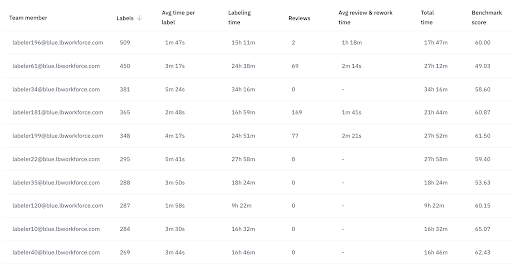
Efficiency
Efficiency is measured by comparing the throughput to the time or cost it takes to produce training data. Labeling operations teams sometimes monitor the average across a group of labelers for simplicity’s sake, but tracking individual labelers’ work will yield more useful information. Teams monitoring individual efficiency metrics can find out whether the fastest labelers are actually producing quality training data — and if so, share their strategies with the larger workforce to increase overall efficiency. These metrics can also help the team find low performing labelers and provide more guidance to help them improve.
Quality
It’s increasingly clear that training data quality is paramount to building a performant ML model. To monitor the quality of training data, teams should focus on the consistency of annotations (how similarly two labelers annotate the same asset) as well as accuracy (how the labelers’ work compares to a “ground truth” labeled asset). Incorporating benchmarking and consensus workflows into the labeling process and monitoring results to refine labels, retrain labelers, and root out discrepancies and misunderstandings will significantly improve the quality of your training data.
To learn more, watch the webinar recording here. You can also read more about how you can improve the throughput, efficiency, and quality of your labeling operations in this article from Labelbox Cofounder and COO, Brian Rieger.