×![]()

 All blog posts
Labelbox•January 28, 2019
How to Measure Quality when Training Machine Learning Models

A Deep Dive Into Benchmarks, Consensus and Review
Training data quality is critical for a machine learning model's performance. Quality is measured by both the consistency and the accuracy of labeled data. The industry standard methods for calculating training data quality are benchmarks (aka gold standard), consensus, and review. As a data scientist in AI, an essential part of your job is figuring out what combination of these quality assurance procedures is right for your project.
In this article you will learn:
- The definitions of quality, consistency and accuracy and why they matter
- The industry standard methods to quantify quality
- The most cutting-edge tools to automate quality assurance processes
Consistency vs. Accuracy
Quality is comprised of consistency and accuracy. It is not just how correct a label is, but also how often it is correct. This section describes the industry standard methods for measuring consistency and accuracy.
Consistency is the degree to which labeler annotations agree with one another. Consistency prevents random noise by ensuring that labels are correct or incorrect in a consistent manner. Consistency is measured through a consensus algorithm. Without the automation of cutting-edge AI tools, this process is manual, time intensive, and a security liability. Since labels can be consistently right or consistently wrong, high consistency alone is not enough to fully explain quality.
Accuracy measures how close a label is to the 'Ground Truth'. Ground truth data is a subset of the training data labeled by the knowledge expert or data scientist to test annotator accuracy. Accuracy is measured through benchmarks. Benchmarks enables data scientists to monitor the overall quality of their data and then investigate and troubleshoot any potential dips in quality by providing insight into the accuracy of the labelers work.
Review is another method to ensure accuracy. Once the labels have been completed, a trusted expert reviews label accuracy. The review is usually conducted by visually spot checking labels, but some projects review all labels. Review is often used to identify low-accuracy and inconsistencies in the labeling process while benchmarks is often used to get a sense of labeler performance.
Benchmarks tends to be the cheapest quality assurance option since it involves the least amount of overlapping work. However it only captures a subset of the training data set. Consensus and Review may be more expensive or cheaper than each other depending on the consensus settings and the level of review (both can test 0-100% of the dataset and have multiple labeler overlap).
Quality Workflows
Ideally, quality assurance is an automated process that operates continuously throughout your training data development and improvement processes. With the Labelbox consensus and benchmark features, you can automate consistency and accuracy tests. The tests allow you to customize the percentage of your data to test and the number of labelers that will annotate the test data. For many data scientists, discovering the best combination of quality assurance tests for a project is often an emergent process in which clarity is gained through experimentation.
Benchmarks
Benchmarks workflow
- Create a new Benchmark by starring an existing label
- (Automatic) Labelers get benchmarked at random intervals
- Keep track of your project’s overall quality and dive into any deviation, either by labeler (3a) or by benchmark (3b).
Tip: Many find it helpful to follow along with the examples by trying it out yourself with the free version of Labelbox.
Benchmarks Example
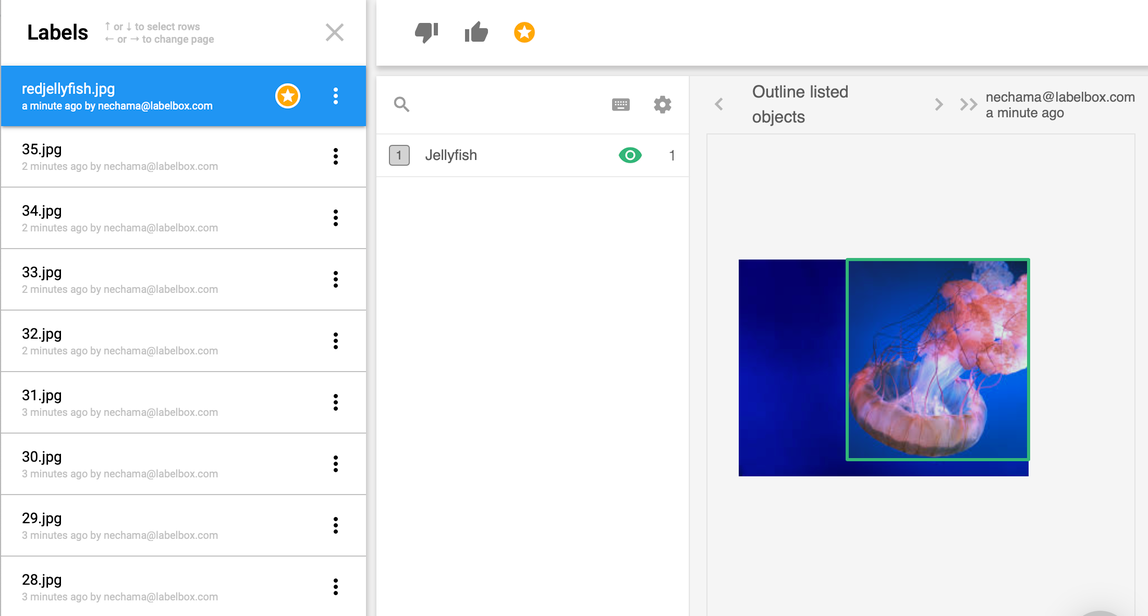
Below is a sample jellyfish project to exemplify the benchmarks workflow summarized above. This project uses a rectangular bounding box, but there are polygon and point options for more fine-tuned shapes.Once you have started a project and labeled the ground truth data, you can tag the labels with the benchmark star.
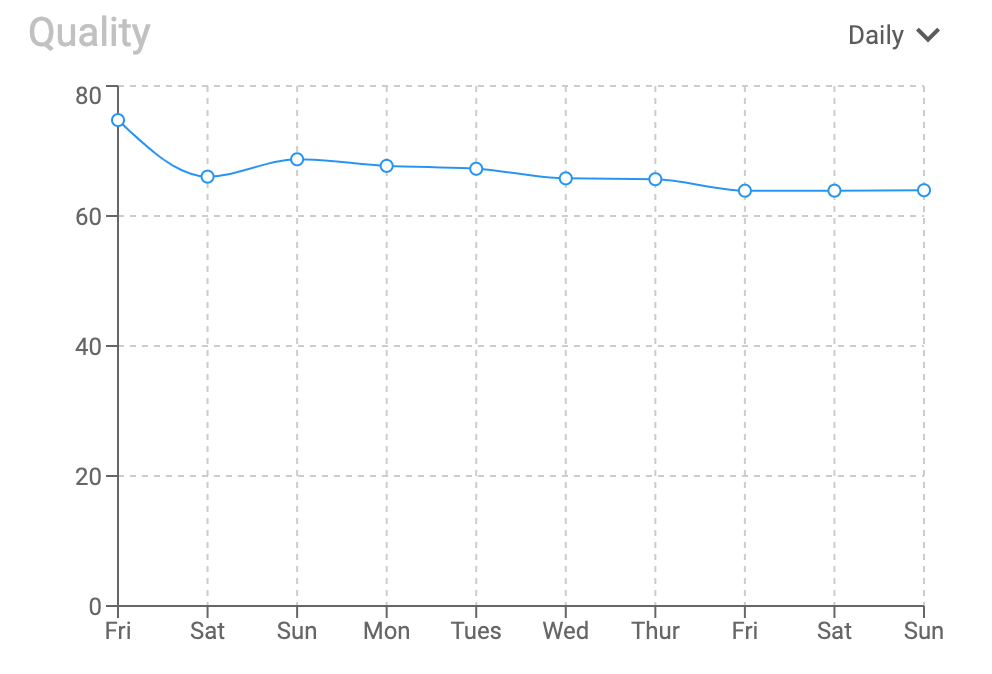
As the labelers are randomly benchmarked, you can monitor project quality with the overall quality graph.
To troubleshoot drops in quality, you can explore performance by labeler or benchmark.
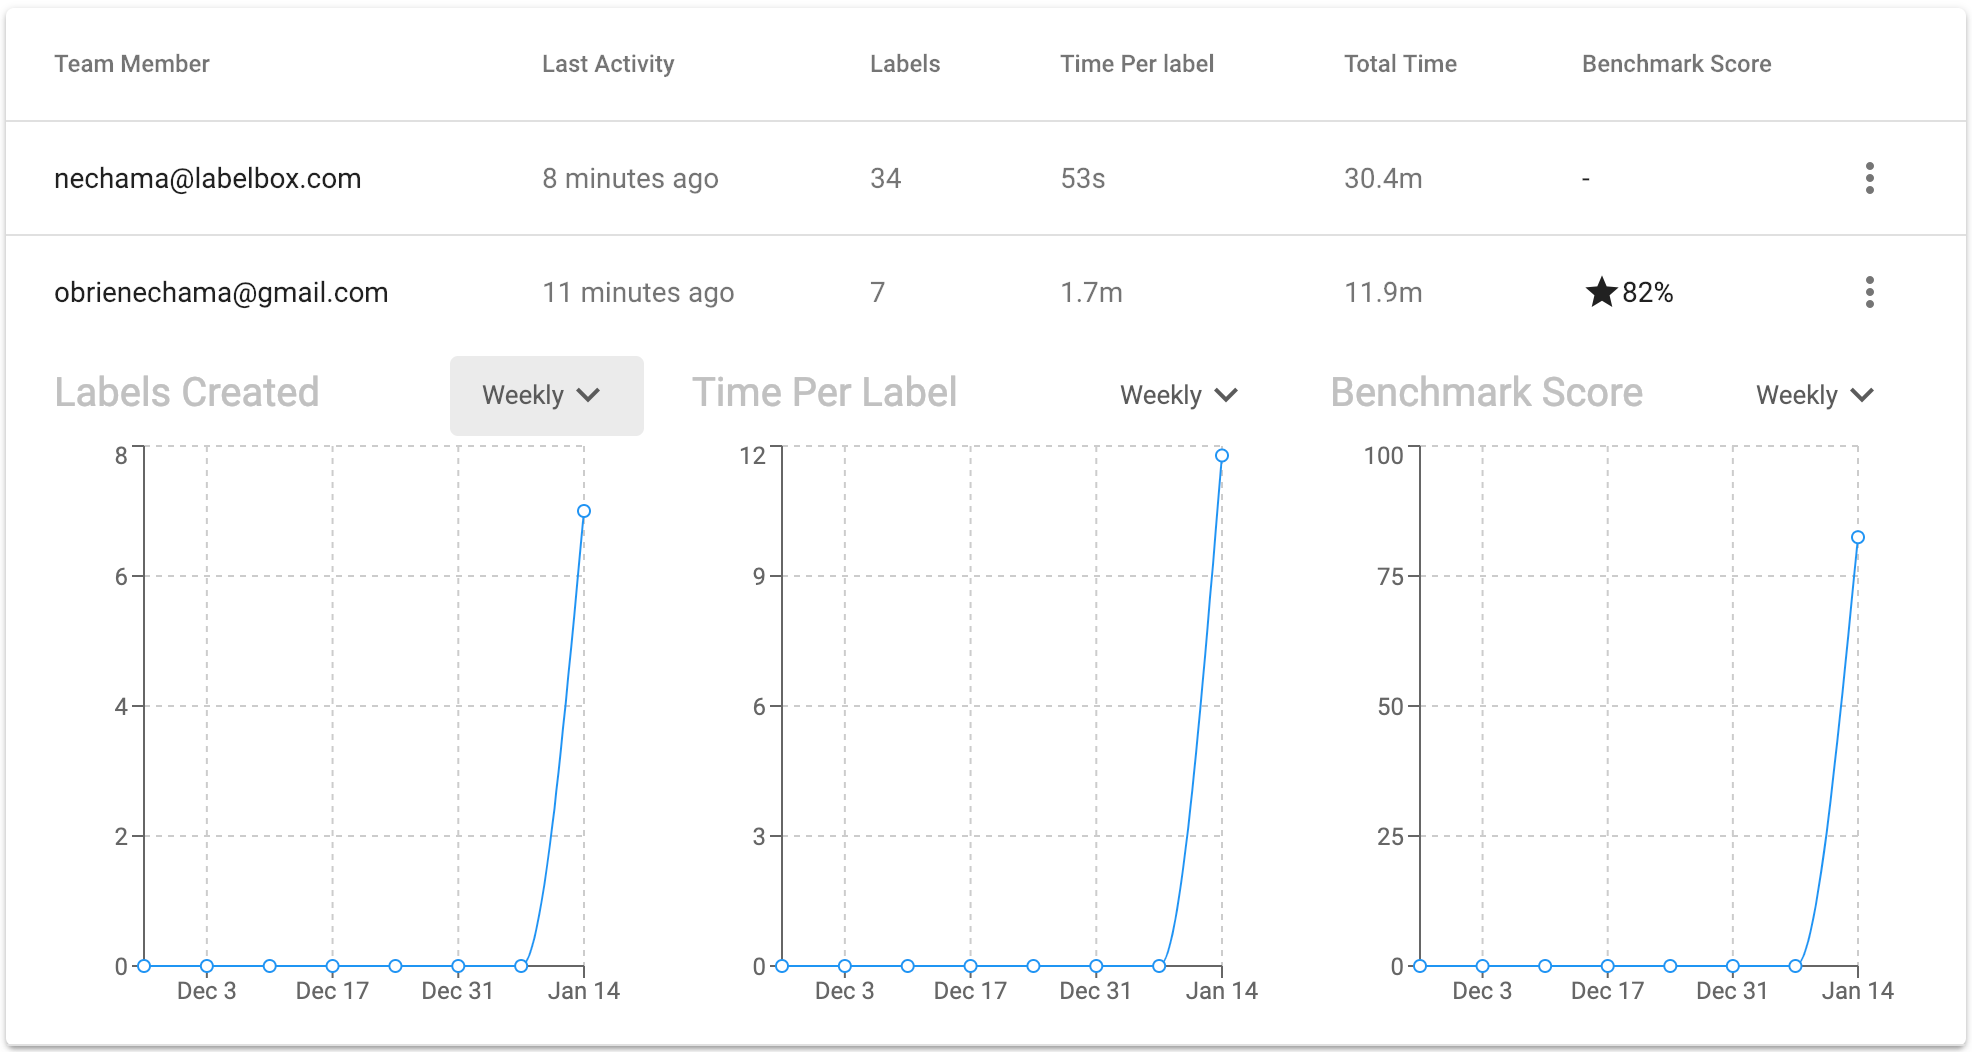
Systemic poor labeler performance is often indicative of poor instructions, while poor performance on certain pieces of data is often indicative of edge cases. Data scientists use these values to help them improve labeler on-boarding and education processes.
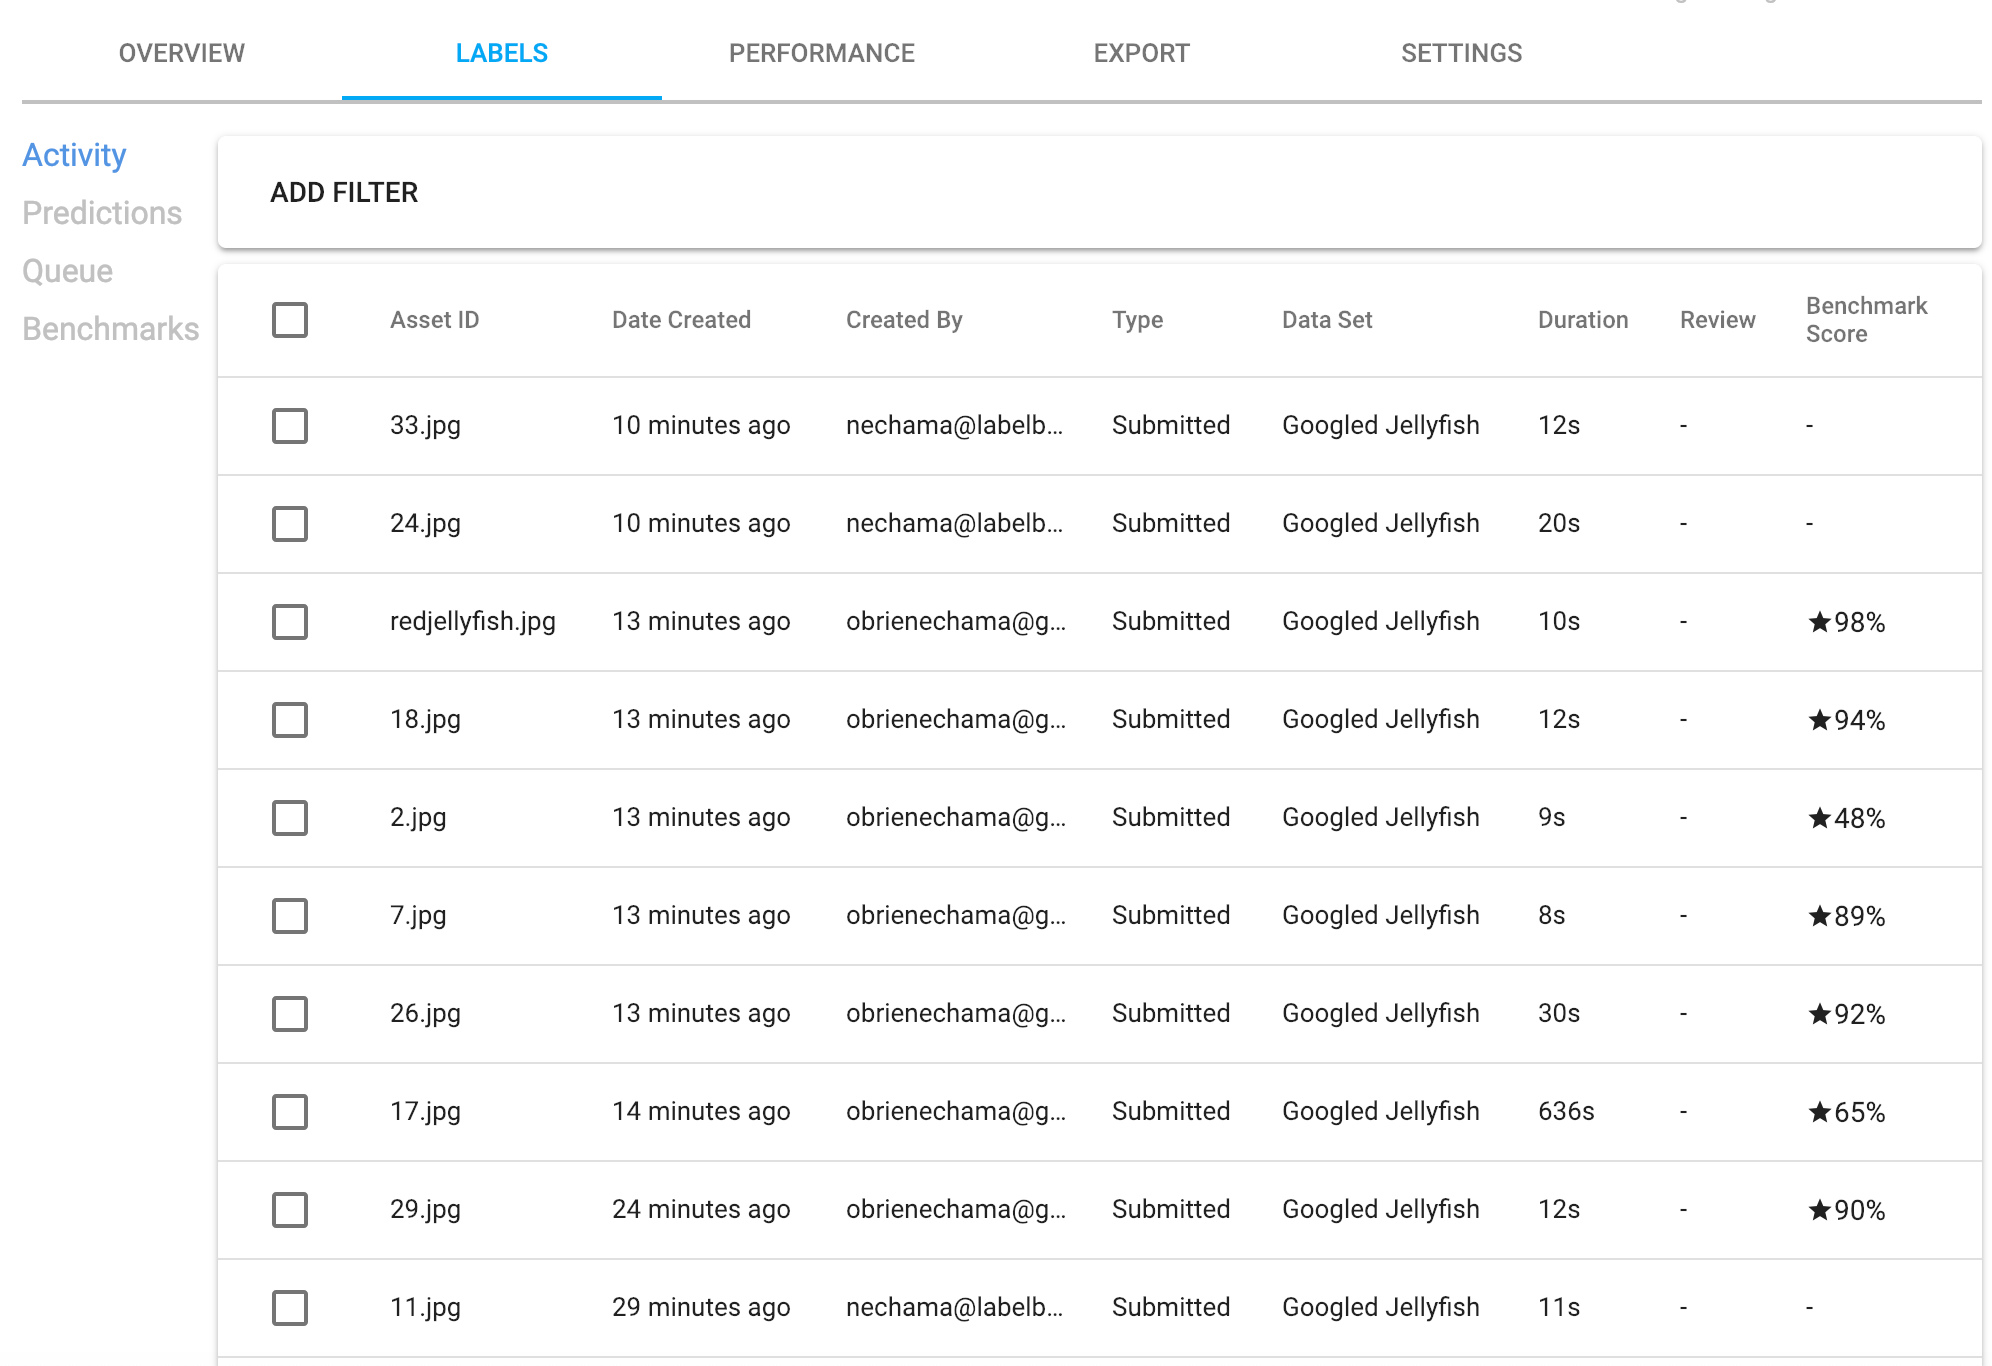
By clicking on the benchmark with 65% accuracy, you can see the crowded jellyfish image and compare it to the benchmark.
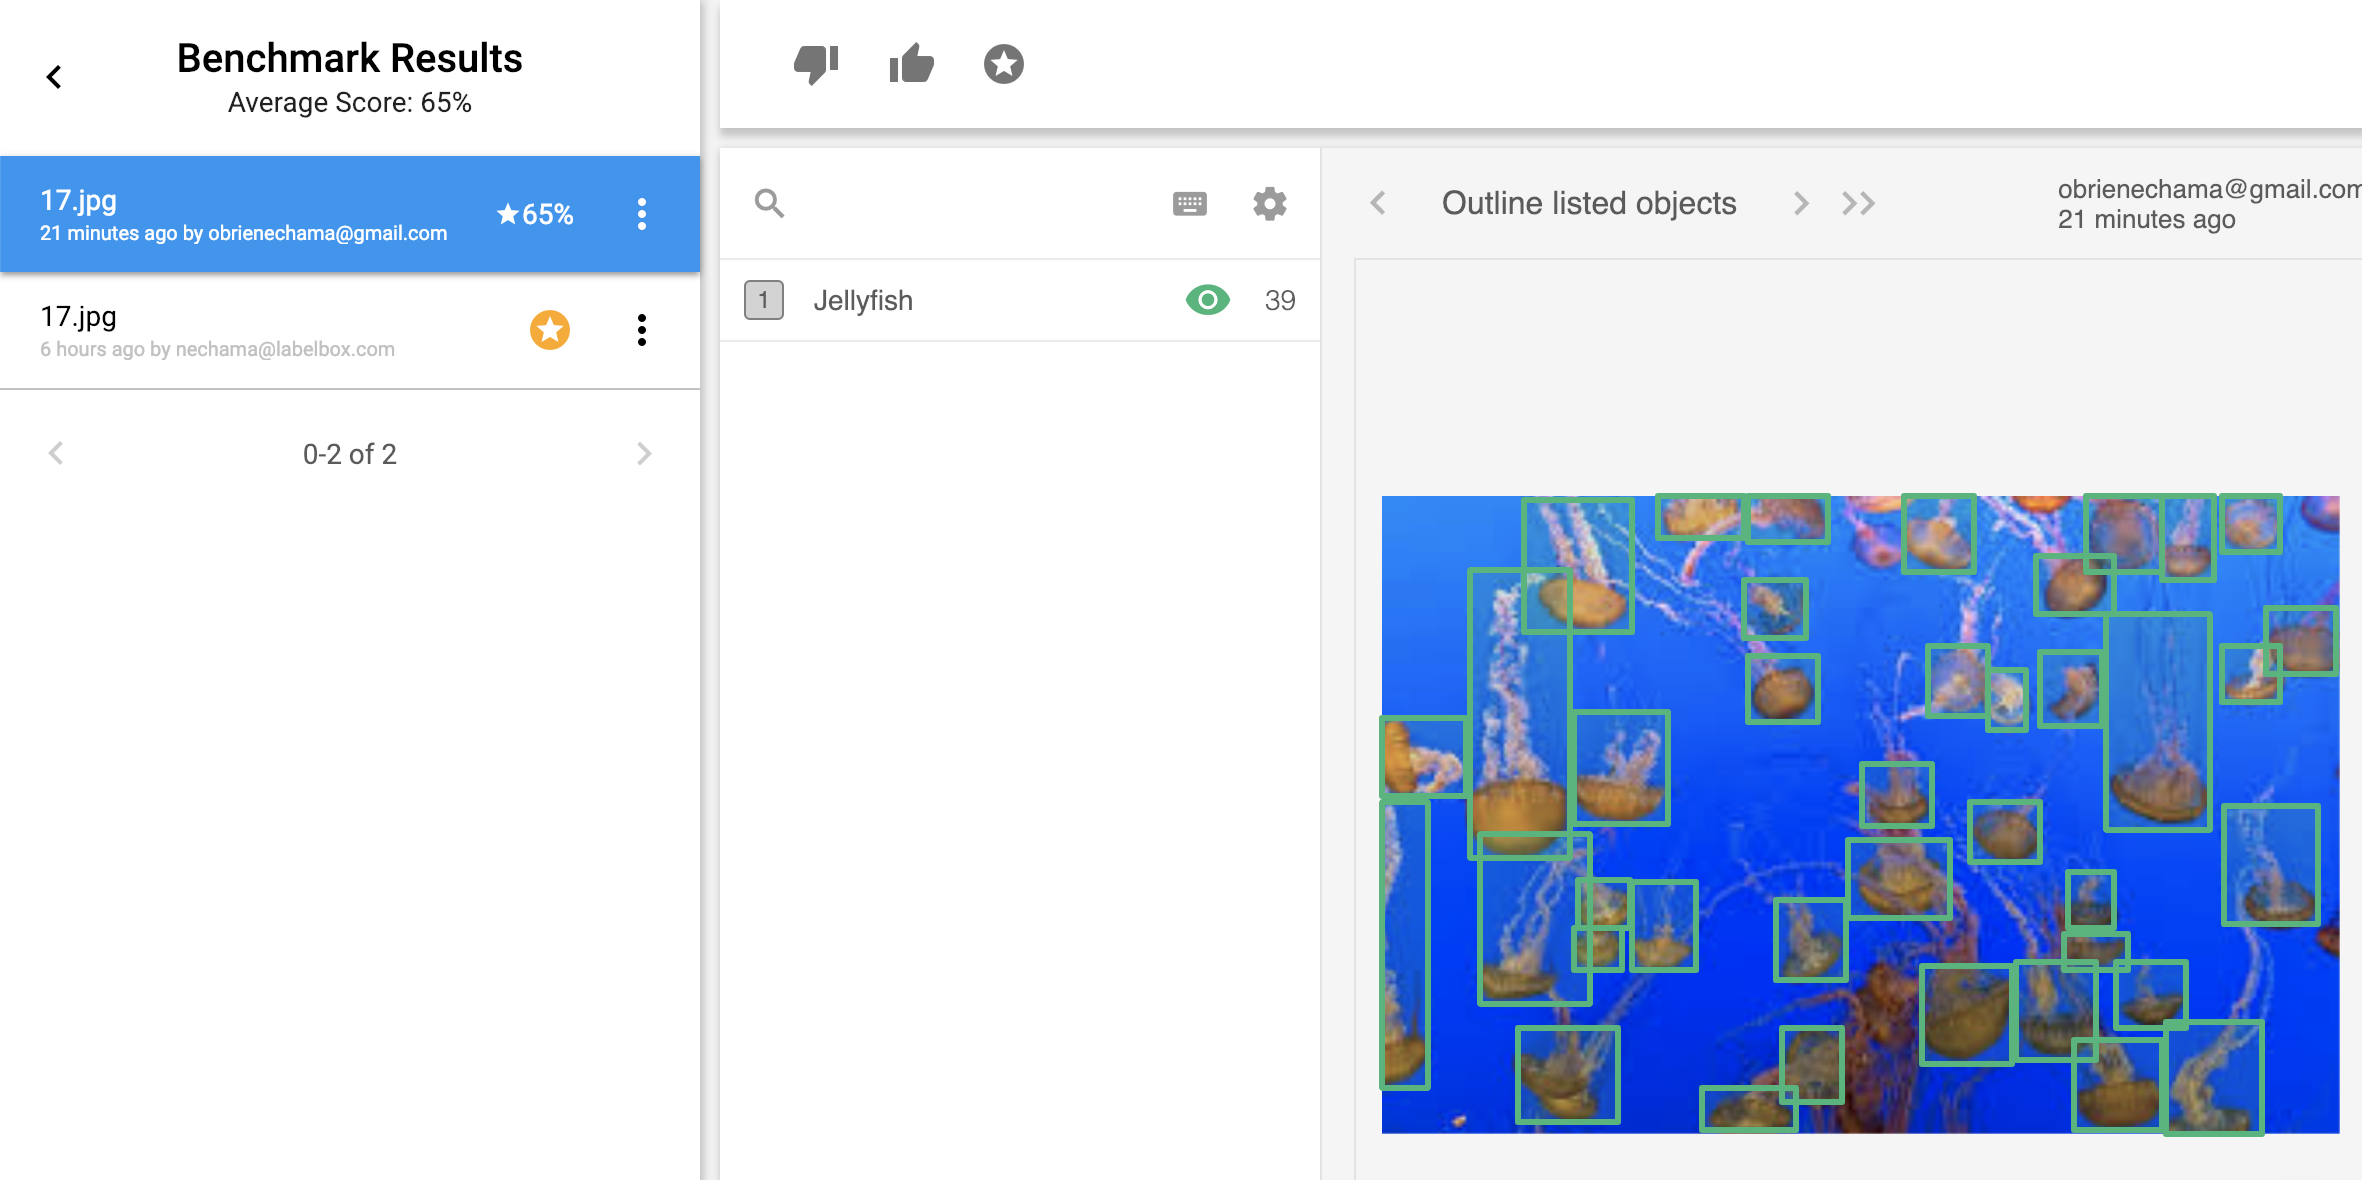
While they are very similar, the labels tend to disagree on how much of the tentacle to include in each bounding box. From here you can either edit, or delete and re-queue the label.
Data labeling is an iterative process. Often our idea of what we think we should label evolves as we become more intimate with the project. For example, maybe at the onset it made sense to label the entire jellyfish. However, it is plausible that the very thin long whispery tentacles might confuse the model rather than improve its performance. The model might start identifying any sliver of a line, especially near the edges of the photo, with an occluded jellyfish when it very well might just be underwater plant debris or the tendril of sea anemone. Because this is not a well recognized problem, the ability to numerically and visually monitor and iterate on training data is often under valued.
Consensus
Consensus measures the rate of agreement between multiple annotators (human or machine). A consensus score is calculated by dividing the sum of agreeing labels by the total number of labels per asset.
Consensus Workflow
- Enable consensus and customize the consensus parameters
- (Automatic) Random labels are distributed across labelers at random intervals
- Keep track of overall consistency and investigate any dips in quality by looking into individual labeler and label consensus scores
Consensus Example
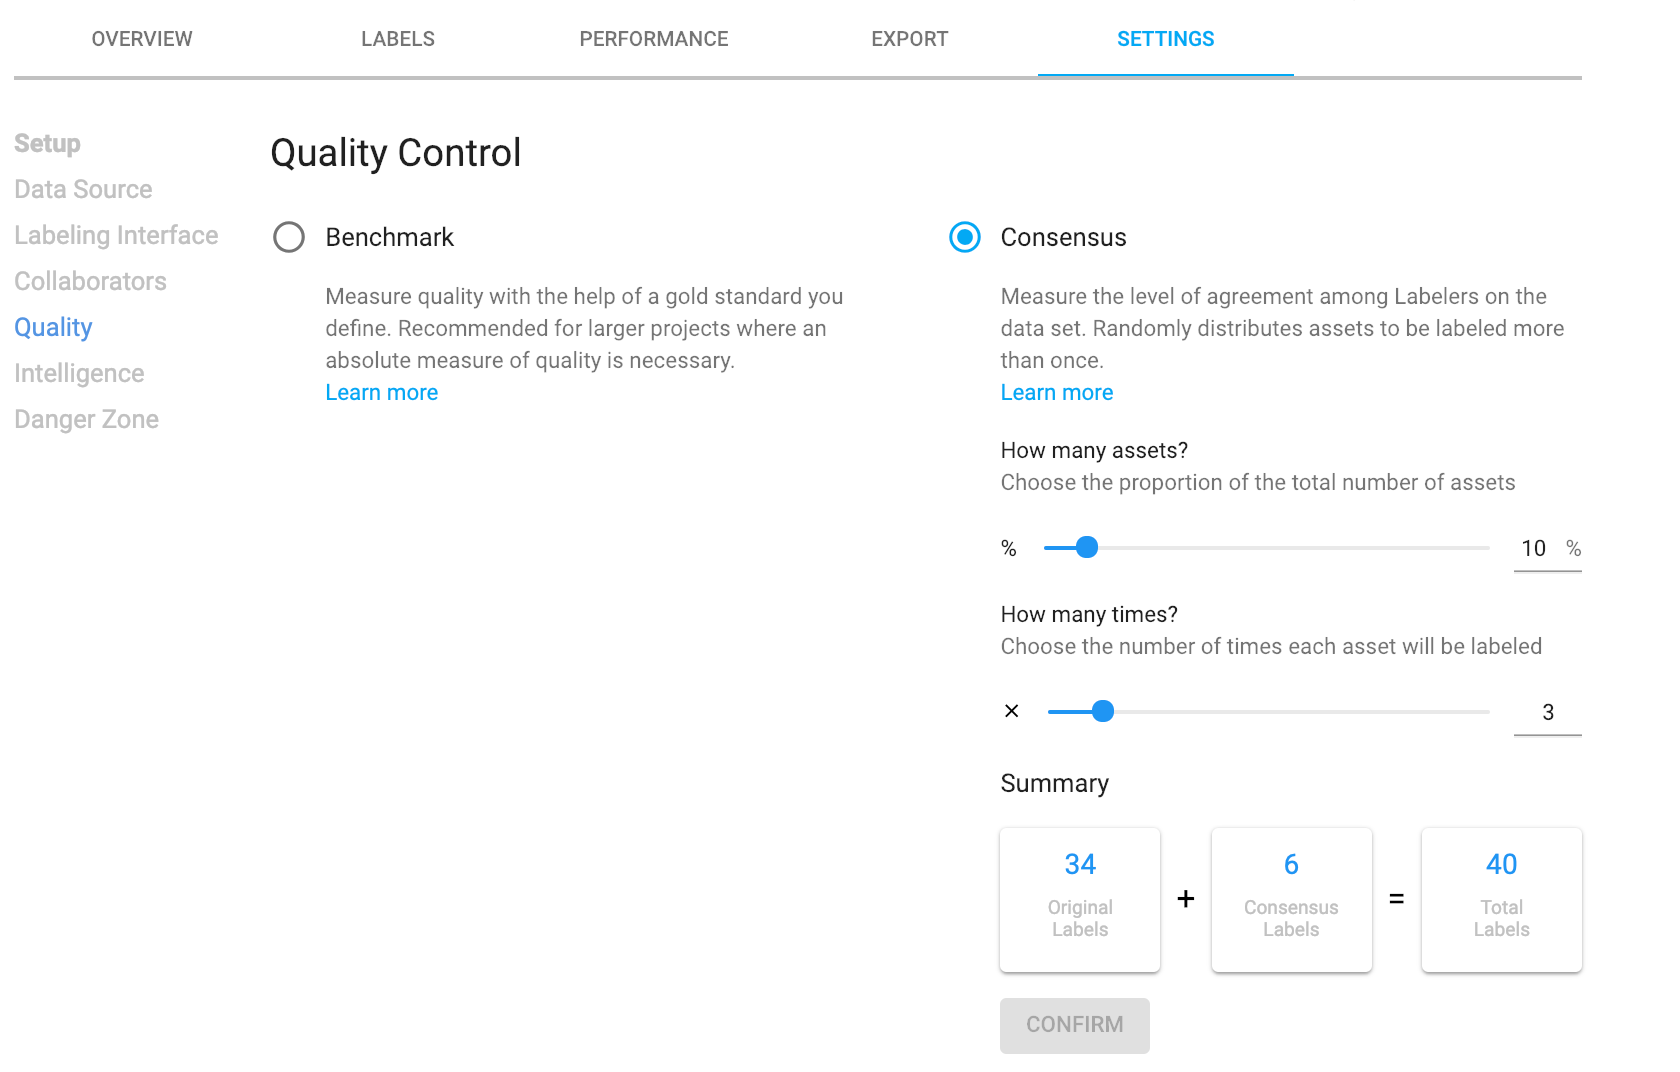
To configure consensus, you can customize the percentage of training data and the number of labelers to test.
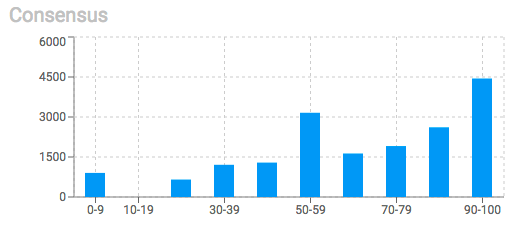
Monitor overall consistency with the Consensus histogram.
Breakdown the consensus score by asset. Here you can compare the labels of a particular image. This is a collaborative part of research and development and that enables AI teams to innovate on projects. Points of disagreement can be opportunities to think about the problem from other perspectives, which in turn can spark new solutions.
Typically, there is an agile progression to data labeling. Often the most successful AI models in production have had labeling tasks that evolved over time to better fit their use cases. Meaning, as visual engineers get more familiar with the problem they are able break it down and solve it in steps with models curating images for other models down the line to drive efficiencies. In other words, effective modeling plays to the repetition and precision strengths of machines by creating a production line of atomic tasks.
Review
Having control of data with a tight feedback loop between humans and machines empowers teams to build great ML applications. Visualizing data is paramount, not only for trouble shooting quality issues, but also for developing a deep understanding of and a sophisticated solution for a machine learning problem.
Review Workflow
Reviewing is a manual rather than automated process. It is part of keeping a human in the loop.
- Choose which labels to review
- Review, modify or re-enqueue labels
Review Example
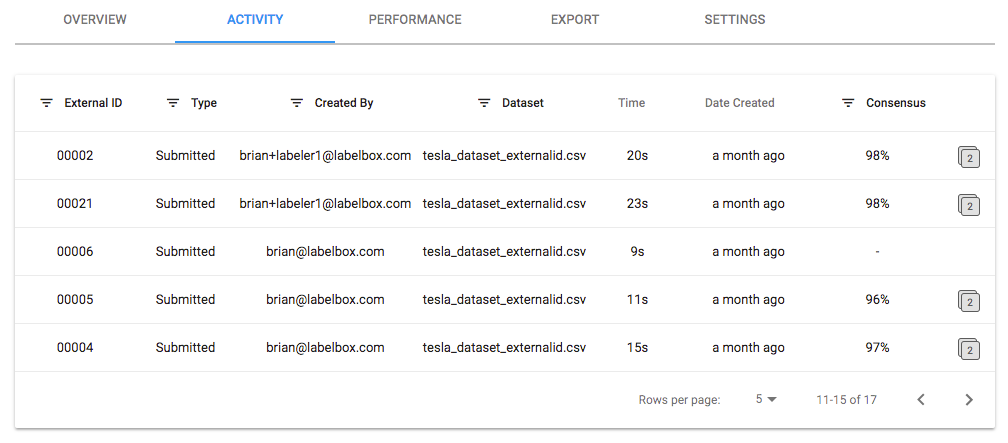
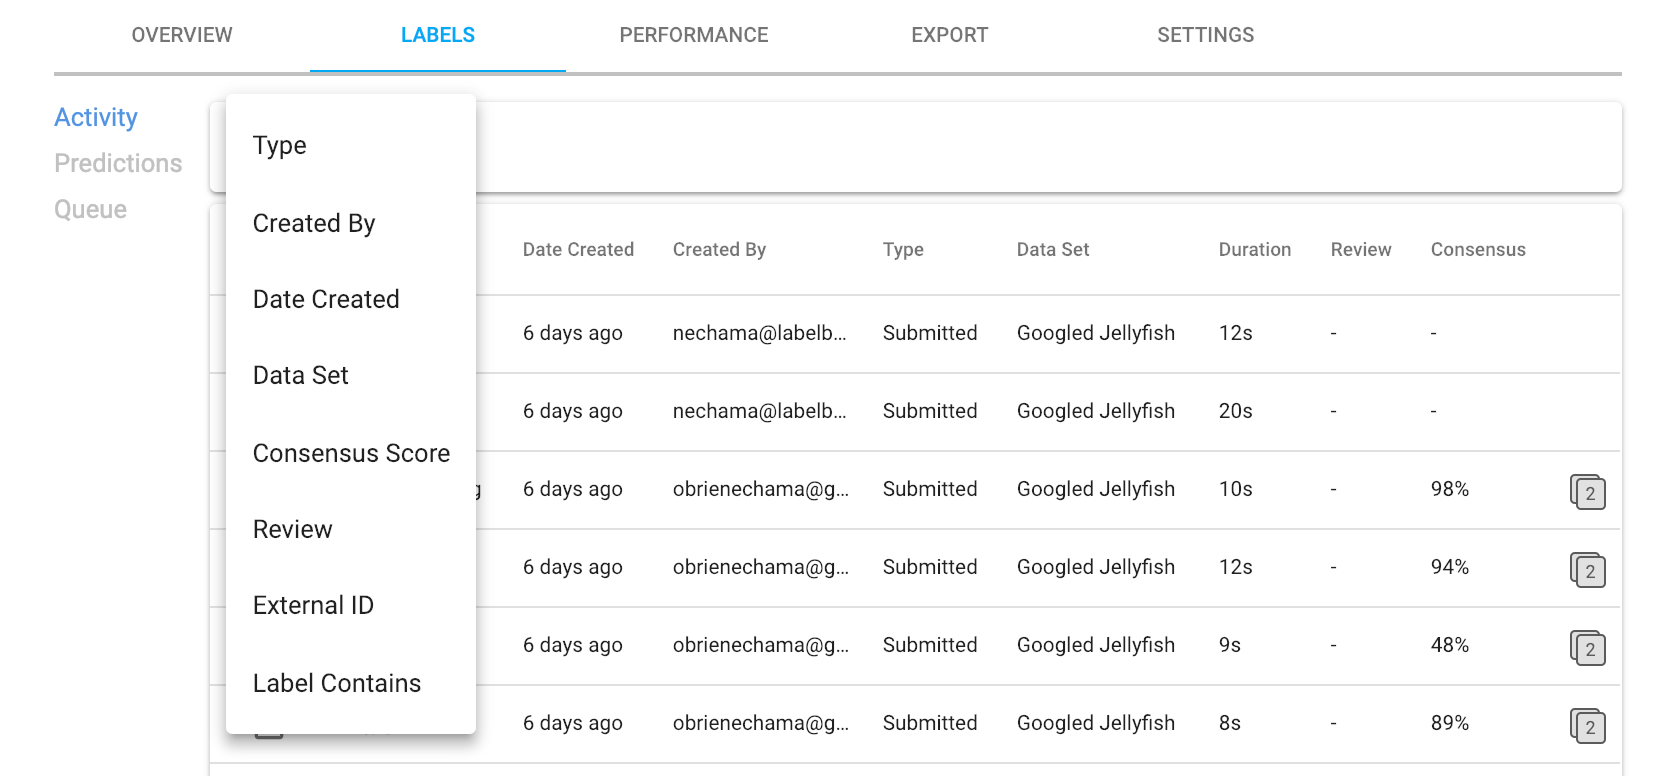
Filtering options help managers prioritize which labels to review. As depicted in the image below, available filters include labeler, consensus score, label contains, and more.
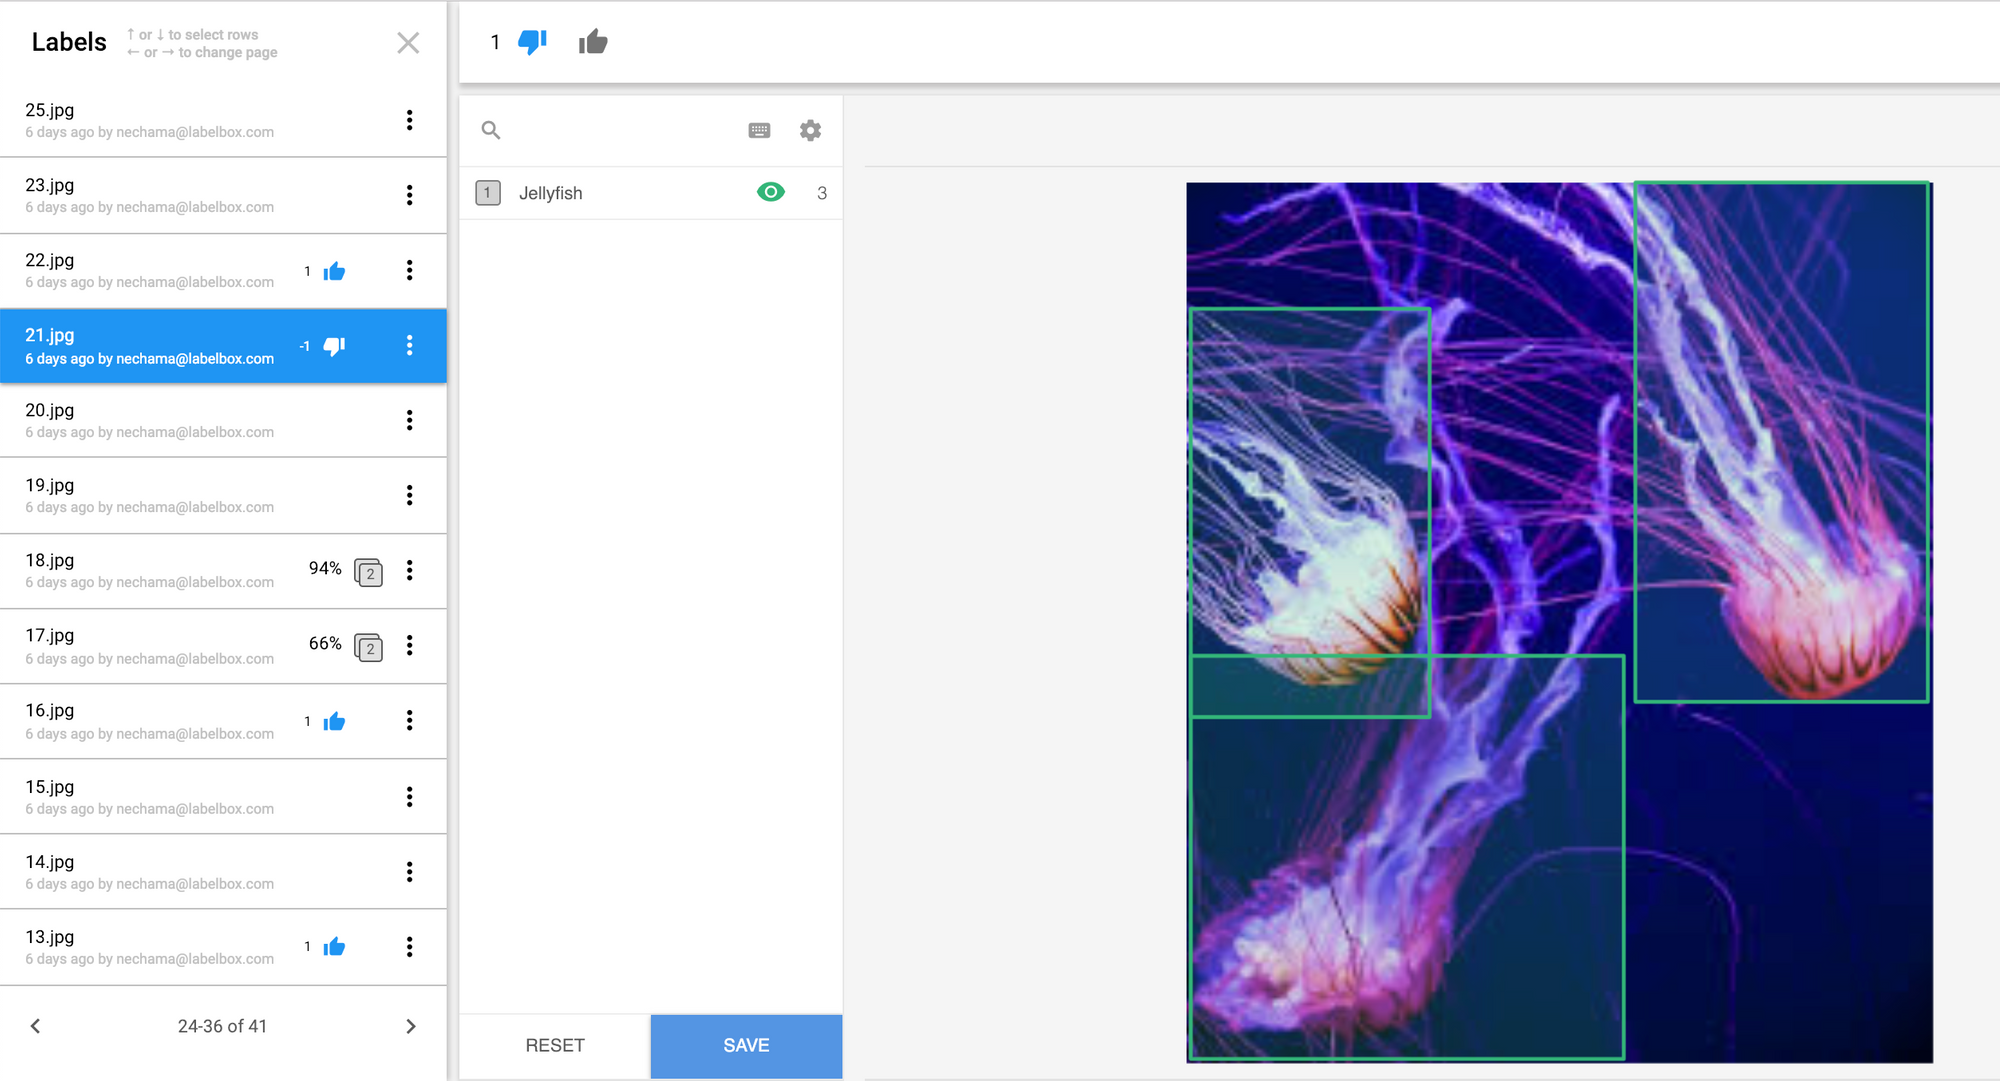
Reviewers are often the top performing labelers or internal knowledge experts. To review a label, there are thumbs up and down icons. The reviewer also has the option to modify or correct the labels on the spot. Additionally, clicking on the three vertical dots allows you to delete and re-enqueue the label, view the benchmark when applicable, and copy the link to send to other collaborators.
Conclusion
Creating training data is often one of the most expensive components of building a machine learning application. Properly monitoring training data quality increases the chance of having a performant model the first time around. And, getting labels right the first time (first pass quality) is far cheaper than the cost of discovering and redoing work to fix the problem. With world class tooling at your fingertips, you can ensure your labeling maintains the level of quality you need to get the modeling results you want.
With Quality Assurance processes data scientists can:
- Monitor overall consistency and accuracy of training data
- Quickly troubleshoot quality errors
- Improve labeler instructions, on-boarding, and training
- Better understand the specifics to their project on what and how to label
Get Started with Labelbox
Visit www.labelbox.com to explore Labelbox for free or speak to one of our team members about an enterprise solution for your business.


