All guides
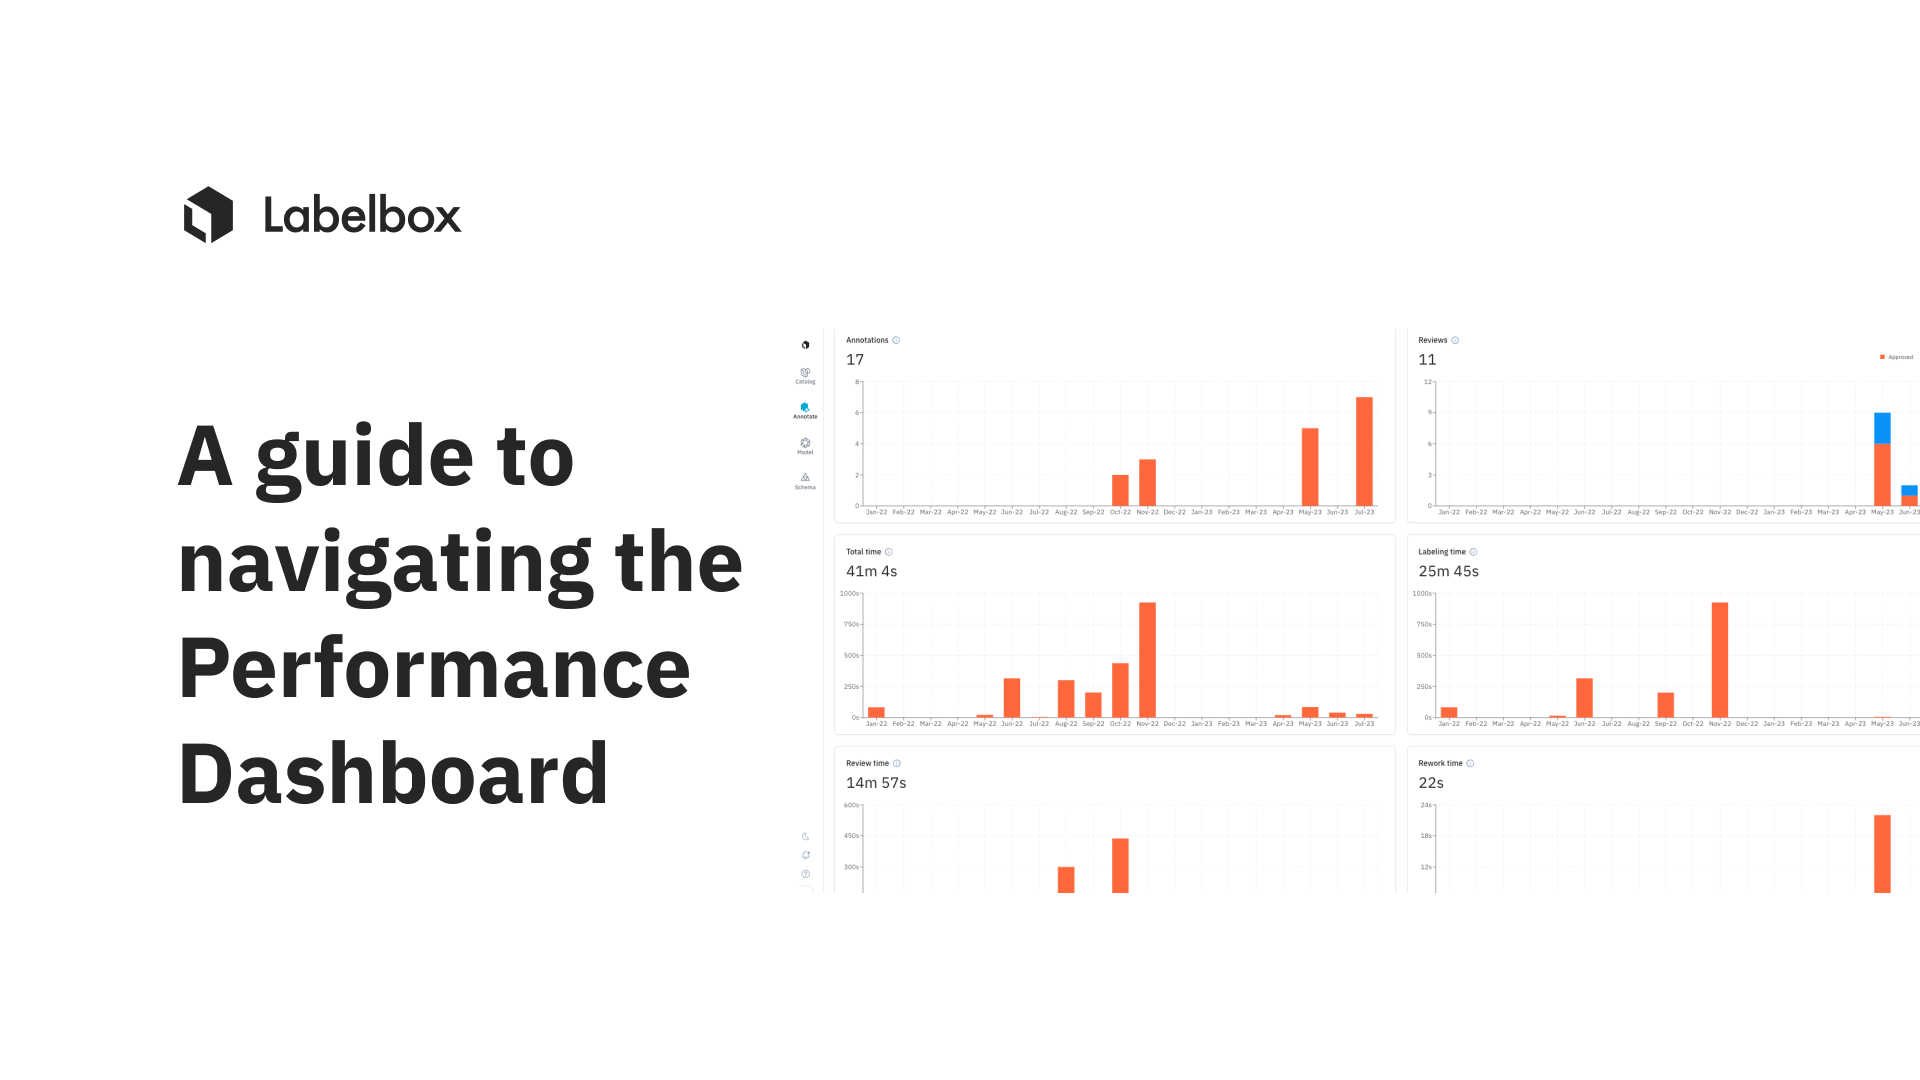
A guide to navigating the Performance Dashboard
High-quality training data is crucial for the success of any machine learning model. Having a scalable and systematic way to measure labeling quality is integral to the creation and maintenance of high-quality training data. Labeling quality refers to the accuracy, consistency, and reliability of the annotations produced by human labelers or automated labeling models.
Labelbox’s Performance Dashboard helps teams observe and manage their Labelbox labeling projects. Broken down into three components: throughput, efficiency, and quality, the dashboard provides a holistic understanding of your project’s entire labeling operations. You can learn more about the importance of throughput, efficiency, and quality in our recent blog post.
What is new?
As of late September 2023, we’re introducing key updates to the Performance Dashboard to improve accuracy, provide additional metrics, and offer more insight and granularity into labeling performance:
More accurate time-based metrics
Accurately measuring the time taken to label assets is vital to maintaining and understanding labeling quality and efficiency. To address product feedback around how time was logged and accrued after a label had been created, we made improvements to how time is measured and logged during the labeling process.
- Labeling time will begin once an asset has been loaded in the editor – this is marked by a small green dot on the top-left corner of the screen, indicating that the timer is active and labeling time is being measured.
- If there is no user activity for a continuous period of 5 minutes, the timer will automatically stop and the small green dot will turn gray, indicating that the timer is inactive and labeling time has paused.
The above changes help prevent the accumulation of idle time when a labeler is not actively engaged in the labeling process.
- Ability to detect when a label editor is opened in multiple browser tabs to prevent any instances where labeling time cannot accurately be logged. To notify labelers and reviewers of this occurrence, a full-screen modal will be displayed, ensuring awareness of the timer suspension.
- Time registered for review or rework is now attributed to the time when the activity was marked as done as opposed to when the label was created, providing for a more accurate understanding of time spent reviewing an asset.
The new dashboard will provide more accurate labeling activity metrics based on the changes stated above to calculate labeling time.
Better alignment with workflows
With the migration to using batches, the Data Rows tab, and workflows, for more granular control over your labeling operations, we now look at labeling, review, and rework as separate activities:
- You can now track labeling, review, and rework as separate metrics – this helps provide an understanding of how much total time is spent in each of these stages:
Labeling time: Displays the total time spent labeling data rows
Review time: Displays the total time spent reviewing labeled data rows
Rework time: Displays the total time spent reworking labeled data rows
- Information for labeling and review times on the Performance Dashboard, the Data Rows tab, and Exports come from the same source, providing consistent and accurate metrics.
Dive into more granular analytics
Introducing improvements to help your team dig into more specifics and provide more insight into labeling performance:
- There are now separate tables, that you can toggle between, to evaluate labeling and review activities allowing you to pinpoint any areas of improvement in both stages.
- Drill into an individual member’s performance by clicking on the team member from the Labeling tab of the Member Performance section of the dashboard.
- You can now filter on batch and label deletion status to enable richer diagnosis of performance.
These new observability improvements help to ensure that your labels are high-quality and were designed to accelerate the labeling process and help cut overall annotation and review costs.
As we roll out these improvements across our user base, we encourage you to leverage the new dashboard for better insights and learn more in our documentation.