All guides
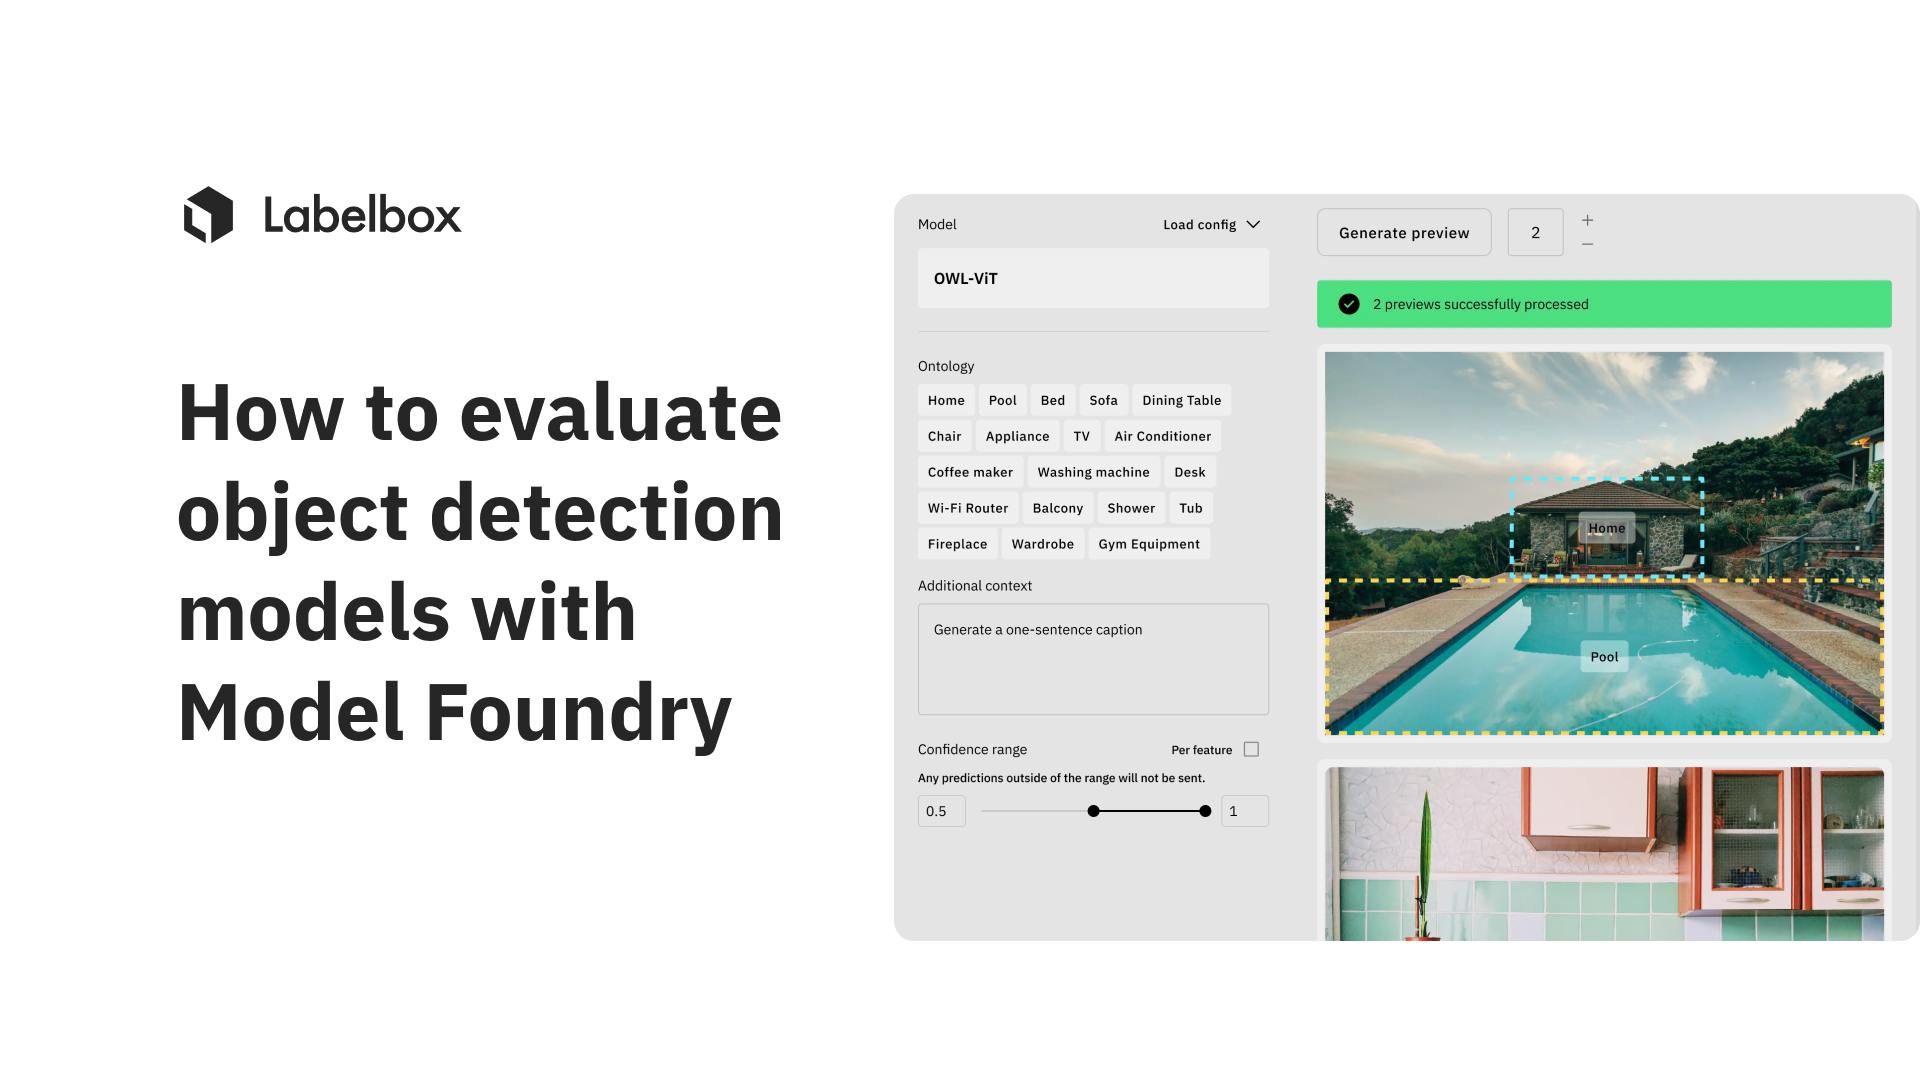
How to evaluate object detection models with Labelbox Model Foundry
The rise of off-the-shelf and foundation models has enabled AI teams to fine-tune existing models and pre-label data faster and more accurately — in short, significantly accelerating AI development. However, using these models at scale for building AI can quickly become expensive. One way to mitigate these costs and reduce waste is to add a model comparison process to your workflow, ensuring that any model you choose to integrate for AI development is the best choice for your requirements.
A comprehensive model comparison process evaluates models on various metrics, such as performance, robustness, and business fit. The results will enable teams to quickly kickstart model development, decrease time to value, and ensure the best results with less time and costs for their specific use case.
Embedding model comparison into the AI development workflow, however, comes with its own unique challenges, including:
- Confidently assessing the potential and limitations of pre-trained models
- Visualizing models’ performance for comparison
- Effectively sharing experiment results
In this blog post, we’ll explore how you can tackle these challenges for a computer vision use case with the Foundry add-on for Labelbox Model.
Why is selecting the right model critical?
Selecting the most suitable off-the-shelf model is pivotal for ensuring accurate and reliable predictions tailored to your specific business use case, often leading to accelerated AI development. As different models exhibit diverse performance characteristics, diligently comparing the models’ predictions on your data can help distinguish which model excels in metrics such as accuracy, precision, recall, and more. This systematic approach to model evaluation and comparison enables you to refine the model’s performance with a “store of record” for future reference to continuously improve model performance.
Choosing the best off-the-shelf model provides a quick and efficient pathway to production, ensuring that the model aligns well with the business objectives. This alignment is crucial for the model's immediate performance and sets the stage for future improvements and adaptability to evolving requirements. The most suitable model for your use case also enables you to reduce the time and money spent on labeling a project. For instance, when pre-labels generated by a high-performing model are sent for annotation, less editing is required, making the labeling project quicker and more cost-effective. This is due to better Intersection Over Union (IOU) for tasks like Bounding Box, resulting in higher quality pre-labels and, therefore, fewer corrections. Furthermore, utilizing the best model can make your trove of data more queryable by enriching your data, thereby enhancing its searchability.
Comparing computer vision models with Labelbox Model Foundry
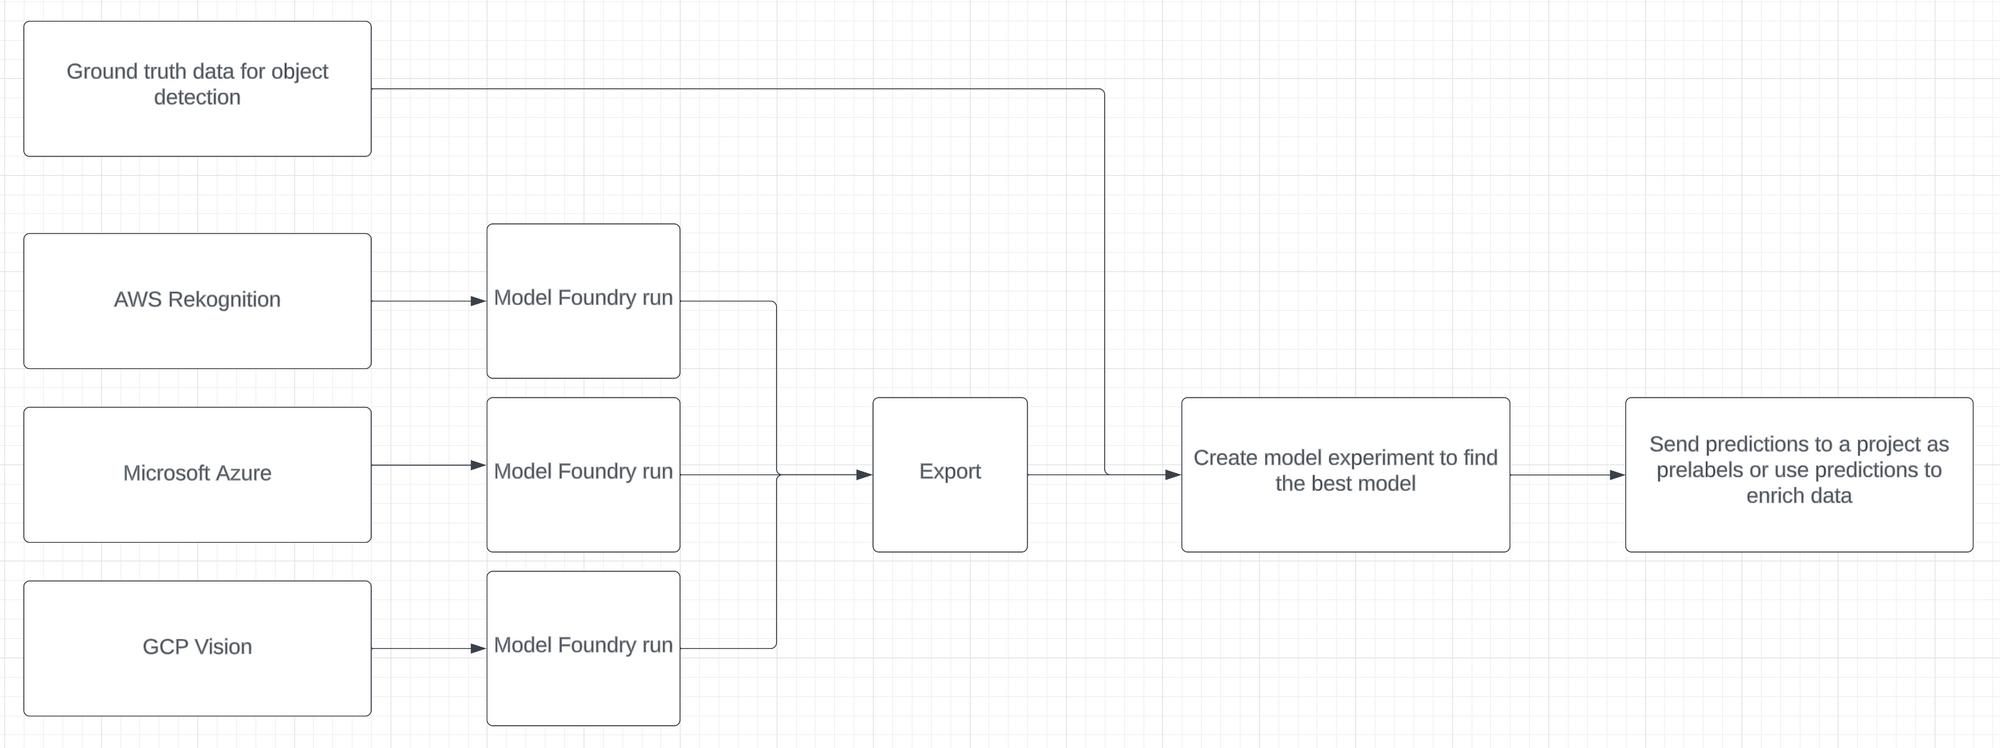
With Labelbox Model Foundry, you can evaluate a range of models for computer vision tasks to select the best model to perform pre-labeling or data enrichment on your data.
Step 1: Select images and choose a foundation model of interest
- To narrow in on a subset of data and refine the images on which the predictions should be made, leverage filters in Catalog, including media attribute, natural language search, and more
- Once you’ve surfaced data of interest, click “Predict with Model Foundry.” You will then be prompted to choose a foundation model that you wish to use in the model run
- Select a model from the ‘model gallery’ based on the type of task — such as image classification, object detection, and/or image captioning
- To locate a specific model, you can browse the models displayed in the list, search for a specific model by name, or select individual scenario tags to show the models available for this machine learning task
Step 2: Configure model hyperparameters and submit a model run
Once you’ve located a specific model of interest, you can click into the model to view and set the model and ontology settings.
Each model has an ontology defined to describe what it should predict from the data. Based on the model, there are specific options depending on the selected model and your scenario. For example, you can edit a model ontology to ignore specific features or map the model ontology to features in your own (pre-existing) ontology.
Each model will also have its own set of hyperparameters, which you can find in the Advanced model setting. To get an idea of how your current model settings affect the final predictions, you can generate preview predictions on up to five data rows.
While this step is optional, generating preview predictions allows you to confidently confirm your configuration settings. If you’re unhappy with the generated preview predictions, you can make edits to the model settings and continue to generate preview predictions until you’re satisfied with the results. Once you’re satisfied with the predictions, you can submit your model run.
Step 3: Predictions will appear in the Model tab
Each model run is submitted with a unique name, allowing you to distinguish between each subsequent model run. When the model run completes, you can:
- View prediction results
- Compare prediction results across a variety of model runs different models
- Use the prediction results to pre-label your data for a project in Labelbox Annotate
Step 4: Repeat steps 1-5 for another model from Labelbox Model Foundry
You can repeat steps 1-5 with a different model, on the same data and for the same desired machine learning task, to evaluate and compare model performance. By comparing the predictions and outputs from different models, you can assess and determine which one would be the most valuable in helping automate your data labeling tasks.
Step 5: Create a model run with predictions and ground truth
To create a model run with model predictions and ground truth, users currently have to use a script to import the predictions from the Foundry add-on for Labelbox Model and ground truth from a project into a new model run.
In the near future, this will be possible via the UI, and the script will be optional.
Step 6: Evaluate predictions from different models from Model foundry in Labelbox Model
After running the notebook, you'll be able to visually compare model predictions between two models. Use the ‘Metrics view’ to drill into crucial model metrics, such as confusion matrix, precision, recall, F1 score, and more, to surface model errors.
Model metrics are auto-populated and interactive. You can click on any chart or metric to open up the gallery view of the model run and see corresponding examples.
Step 7: Send model predictions as pre-labels to a labeling project in Annotate
Select the best performing model and leverage the model predictions as pre-labels. Rather than manually labeling data rows, select and send a subset of data to your labeling project with pre-labels to automate the process.
Model comparison in-practice:
Google Cloud Vision vs Microsoft Azure AI
Quantitative comparison
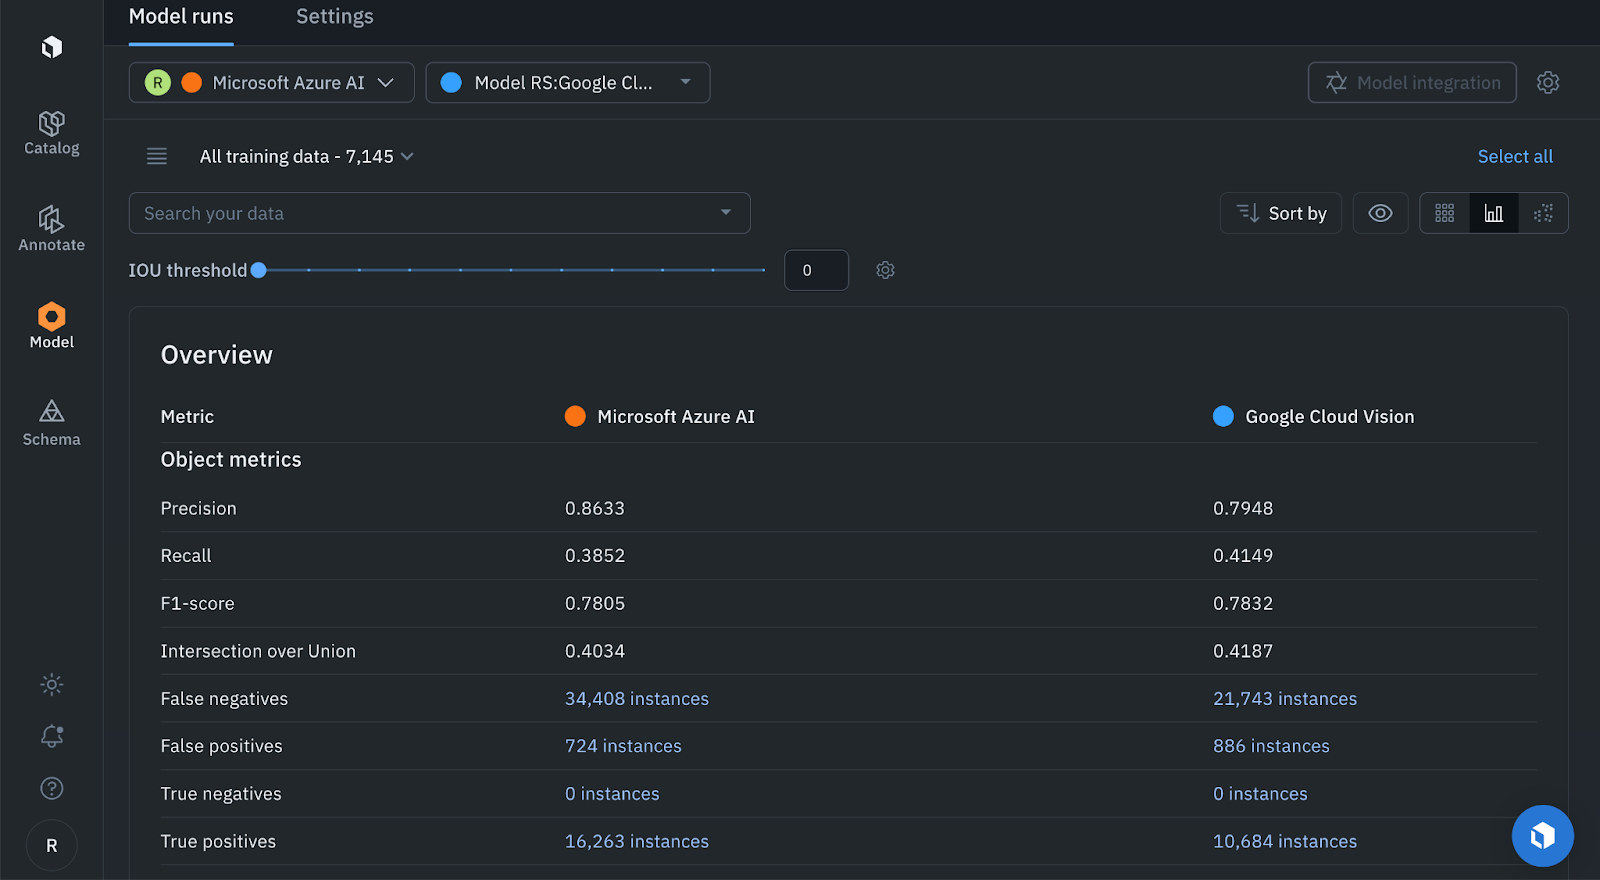
From the metrics overview, we see that Google Cloud Vision outperforms Microsoft Azure AI for recall, f1 score, intersection over union and false negatives.
Microsoft Azure AI boasts a precision score of 0.8633, which outperforms the 0.7948 score of Google Cloud Vision. Microsoft Azure AI has an intersection over union score of 0.4034, an F-1 score of 0.7805, and a recall of 0.3852. In contrast, Google Cloud Vision exhibits a superior intersection over union score of 0.4187, an F-1 score of 0.7832, and a recall of 0.4149.
We can also see that the Microsoft Azure AI model has 12,665 more false negatives than Google Cloud Vision, and for our use case, we want the model with the least false negatives.

F1 scores for both Microsoft Azure AI and Google Cloud Vision Model are generally comparable, with a few instances showcasing superior performance by the Google Cloud Vision Model. Here are the specific results for each category:
- For the train category, Microsoft Azure AI scored 0.857, while Google Cloud Vision Model scored higher with 0.932
- For the boat category, Microsoft Azure AI achieved a score of 0.619, compared to the slightly higher 0.656 of Google Cloud Vision Model
- For the person category, Microsoft Azure AI obtained a score of 0.773, whereas Google Cloud Vision Model marginally outperformed with a score of 0.785
- For the airplane, Microsoft Azure AI scored 0.868, with Google Cloud Vision Model again performing better with a score of 0.893
- For the bus category, Microsoft Azure AI had a score of 0.705, significantly lower than the 0.925 achieved by Google Cloud Vision Model

Generally, the Google Cloud Vision Model exhibits superior performance in terms of intersection over union for classes such as train, boat, person, airplane, and bus. Intersection over union (IOU) is crucial as it dictates the accuracy of the bounding box prediction area.
- For the train category, Microsoft Azure AI scored 0.304, while Google Cloud Vision Model significantly outperformed with a score of 0.745
- For the boat category, Microsoft Azure AI achieved a score of 0.251, compared to a higher 0.394 by Google Cloud Vision Model
- For the person category, Microsoft Azure AI secured a score of 0.697, with Google Cloud Vision Model slightly ahead at 0.704
- For the airplane category, Microsoft Azure AI scored 0.603, whereas Google Cloud Vision Model again demonstrated superior performance with a score of 0.738
- For the bus category, Microsoft Azure AI recorded a low score of 0.05, markedly lower than the 0.637 achieved by Google Cloud Vision Model

In summary, Google Cloud Vision Model exhibits superior recall values across the categories of train, boat, person, airplane, and bus.
- For the train category, Microsoft Azure AI exhibited a recall of 0.331, while Google Cloud Vision Model showcased a considerably higher recall of 0.769
- For the boat category, Microsoft Azure AI demonstrated a recall of 0.203, compared to a higher 0.308 by Google Cloud Vision Model
- For the person category, Microsoft Azure AI achieved a recall of 0.618, with Google Cloud Vision Model slightly ahead at 0.622
- For the airplane category, Microsoft Azure AI registered a recall of 0.719, whereas Google Cloud Vision Model marginally outperformed with a recall of 0.747
- For the bus category, Microsoft Azure AI posted a low recall of 0.04, significantly lower than the 0.652 achieved by Google Cloud Vision Model
Qualitative comparison
Let’s now take a look at how the predictions appear on the images below

Here we can see that the model from Google Cloud Vision has a blue bounding box that properly captures the dimension of the airplane. Whereas Azure’s orange bounding box only covers ~3/4 of the airplane.

Another example where Google Cloud Vision in blue bounding box has better IOU than Azure model’s orange bounding box. Based on the qualitative and quantitative analysis above, Google Cloud Vision is the superior model compared to Microsoft Azure AI.
Google Cloud Vision vs Amazon Rekognition
Quantitative comparison

From the metrics overview, Amazon Rekognition generally demonstrates better performance in false negatives, true positives, recall, and IOU against Google Cloud Vision.
- For false negatives, Amazon Rekognition reported 21,935, whereas Google Cloud Vision had a slightly higher count of 22,868
- For true positives, Amazon Rekognition significantly outperformed with 25,953, compared to 10,112 recorded by Google Cloud Vision
- For recall, Amazon Rekognition showcased a higher value of 0.5419, while Google Cloud Vision exhibited a lower recall of 0.3913
- For Intersection over Union (IOU), Amazon Rekognition achieved a score of 0.4596, surpassing the 0.4212 scored by Google Cloud Vision

Amazon Rekognition outperformed Google Cloud Vision in the train, airplane, and bus categories
- For the train category, Amazon Rekognition achieved an F-1 score of 0.969, outperforming Google Cloud Vision, which scored 0.932
- For the boat category, Amazon Rekognition scored 0.747, while Google Cloud Vision significantly outshone with a score of 0.956
- For the person category, Amazon Rekognition registered an F-1 score of 0.566, with Google Cloud Vision achieving a higher score of 0.773
- For the airplane category, Amazon Rekognition had an F-1 score of 0.919, slightly higher than the 0.893 scored by Google Cloud Vision
- For the bus category, Amazon Rekognition secured an F-1 score of 0.929, marginally outperforming Google Cloud Vision, which scored 0.925

Amazon Rekognition led in the bus, boat and person categories,
- For the train category, Amazon Rekognition has an IOU score of 0.741, closely competing with Google Cloud Vision which scored 0.745
- For the boat category, Amazon Rekognition outperformed with an IOU score of 0.454, compared to Google Cloud Vision's 0.394
- For the person category, Amazon Rekognition significantly led with a score of 0.813, while Google Cloud Vision scored 0.704
- For the airplane category, Amazon Rekognition recorded an IOU of 0.677, slightly below Google Cloud Vision's 0.738
- For the bus category, Amazon Rekognition and Google Cloud Vision scored closely with IOU scores of 0.65 and 0.637 respectively
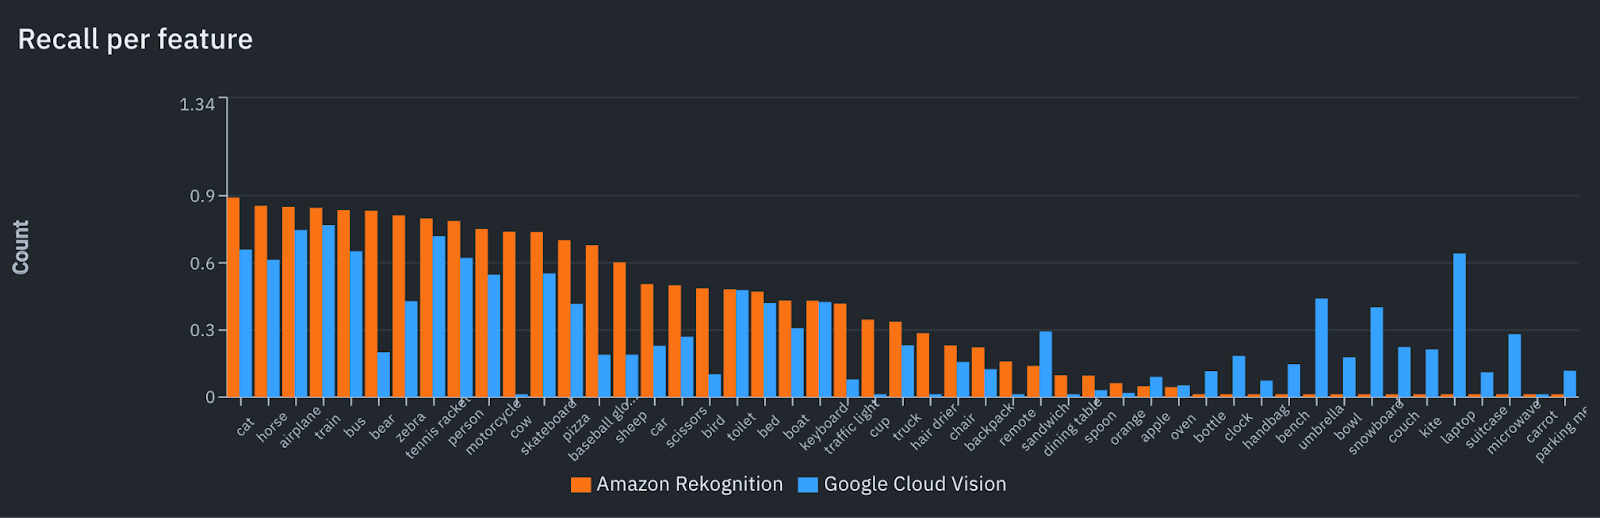
Recall for Amazon Rekognition for boat, person, airplane, and bus, is better than Google Cloud Vision.
- For the train category, Amazon Rekognition demonstrated a recall score of 0.893, while Google Cloud Vision significantly outperformed with a score of 0.983
- For the boat category, Amazon Rekognition led with a recall score of 0.432, compared to Google Cloud Vision's lower score of 0.308
- For the person category, Amazon Rekognition achieved a higher recall score of 0.787, surpassing Google Cloud Vision's 0.622
- For the airplane category, Amazon Rekognition outperformed with a recall score of 0.851, as opposed to Google Cloud Vision's 0.743
- For the bus category, Amazon Rekognition showcased a recall score of 0.836, significantly higher than Google Cloud Vision's 0.652
Qualitative comparison

Here, Google Cloud Vision in the orange bounding box has detected only one boat, but Amazon Rekognition has detected 5 more boats, a person, and a car.
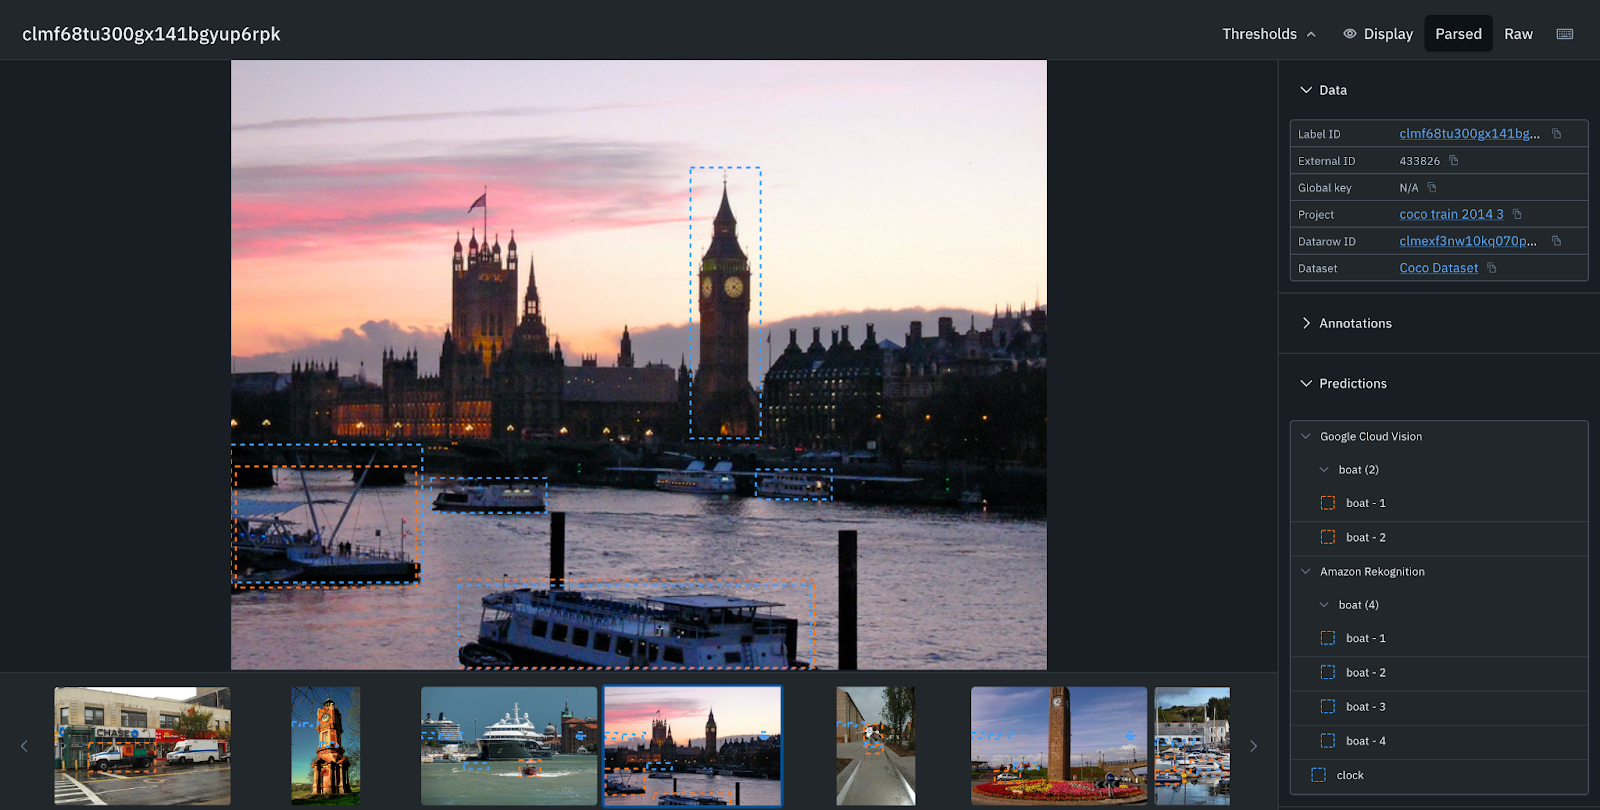
Amazon Rekognition in the blue bounding box has detected more boats and a clock tower.

Amazon Rekognition in the blue bounding box has an IOU of the truck with full coverage, whereas the IOU for Google Cloud Vision is around 90%.
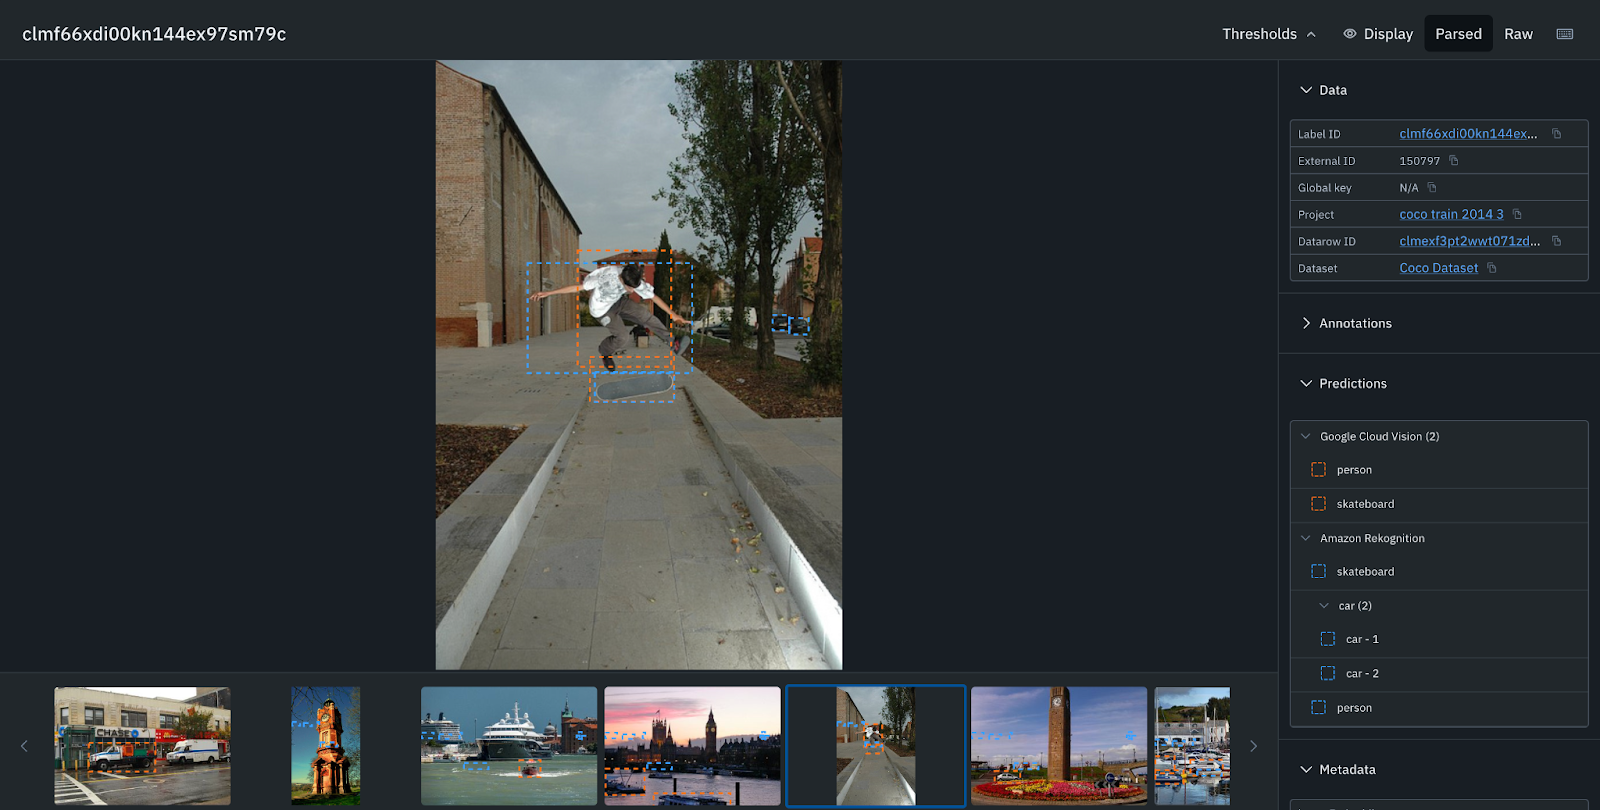
The IOU for person is also better in addition to being able to detect cars in the background for Amazon Rekognition in the blue bounding box compared to Google Cloud Vision. Based on the analysis above, Amazon Rekognition is the best model for our use case.
Send the predictions as pre-labels to Labelbox Annotate for labeling
Since we've evaluated that Amazon Rekognition is the best model for our use case, we can send model predictions as pre-labels to our labeling project by highlighting all data rows and selecting "Add batch to project."

In conclusion, you can leverage the Foundry add-on for Labelbox Model to not only select the most appropriate model to accelerate data labeling, but to automate data labeling workflows. Use quantitative and qualitative analysis, along with model metrics, to surface the strengths and limitations of each model and select the best performing model for your use case. Doing so can help reveal detailed insights, such as seen in the above comparison between Google Cloud Vision and Amazon Rekognition. In the above model comparison example, we can see that Amazon Rekognition emerged as particularly well-suited for our project’s requirements and allows us to rapidly automate data tasks for our given use case.
Labelbox Model Foundry streamlines the process of comparing model predictions, ensuring teams are leveraging the most optimal model for data enrichment and automation tasks. With the right model, teams can easily create pre-labels in Labelbox Annotate – rather than starting from scratch, teams can boost labeling productivity by correcting the existing pre-labels.
Labelbox is a data-centric AI platform that empowers teams to iteratively build powerful product recommendation engines to fuel lasting customer relationships. To get started, sign up for a free Labelbox account or request a demo.