All blog posts
Labelbox•January 20, 2022
How to improve model performance with less data

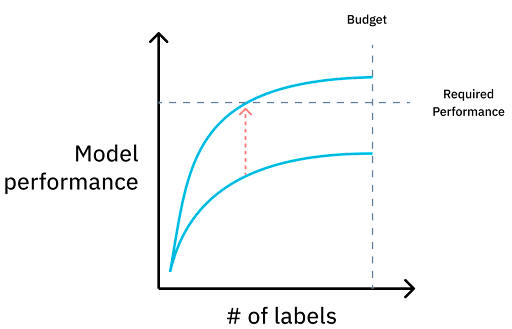
Machine learning has evolved past the traditional method of iterating on the model with a single large training dataset. Today, advanced ML teams extend their focus to carefully selecting their training data, training the model, examining its performance, and modifying the next training dataset accordingly. This data-centric ML method can, according to a recent study from Stanford University researchers, result in anywhere from a 10% to 50% reduction in the amount of training data, depending on the ML task at hand. This can translate into significant time and cost savings for ML teams.
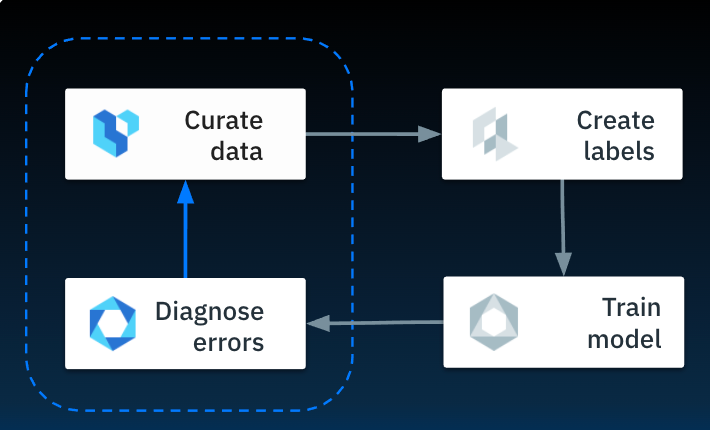
In this post, we’re going to walk through the details of model error analysis and data curation, both of which are vital to data-centric ML.
Model diagnosis
Model performance metrics are generally grouped into two categories: training metrics and summary metrics. Training metrics are evaluated for every epoch while a model is training, and often include measures of loss and accuracy. Usually, these metrics will tell the ML team how well the model is training and whether there are issues with the model itself. Tools like TensorBoard make it easy to view and interact with this data at a high level and improve a model given a specific architecture and dataset.
Summary metrics are measured when the model has finished training to evaluate its performance. Often, teams will use aggregate metrics to measure loss and accuracy, but it’s important to more closely examine these measurements to build a nuanced understanding of the model’s performance and curate your next set of training data accordingly.
Digging deeper into performance metrics
For most computer vision and text models, teams typically use localization and classification error metrics to measure performance. Though errors of both types can have the same root cause, they are worth examining separately to better plan your next steps. One of the most common metrics that measures localization error is intersection over union (IOU) — measuring how well the model prediction covered an object. An IOU score of .5 or .6 is often considered an acceptable level of accuracy, depending on the application.
Another commonly used category of summary metric is precision or recall. These measure any misclassifications and help ML teams identify the level of confidence required to score an example or class.
With aggregate summary metrics, ML engineers might be able to monitor a model’s loss decreasing and its accuracy increasing over iterations, but they are likely to miss other patterns in performance that are vital to the model’s success in a production environment, such as biases that have been inadvertently been “taught.” When teams dig deeper into performance data to look at IOU scores and precision/recall metrics, they’ll usually see that performance is quite varied across the dataset and can address specific issues with the next set of training data.
The process of digging into data can be a challenge with the traditional Jupyter Notebook approach to iteration, where predictions and ground truth can be densely packed and hard to sort through. Having an interactive tool (such as Labelbox’s Model Diagnostics) can be invaluable for this data-centric approach to ML.
Curating training data
Data-centric ML requires two key considerations with respect to training data:
- How well it’s labeled for your specific use case
- Which labeled assets are in the dataset for each iteration
Curating a dataset based on the performance metrics discussed above is vital if an ML team wants to reduce the overall amount of training data required to get a model to production-level accuracy.
When deciding what to add to the next training dataset, there are three key objectives to keep in mind:
- Rarity. Ensuring that each class is appropriately represented within the dataset.
- Redundancy. If two assets are too similar, they won’t be as informative for the model. For example, a computer vision model training on images of vehicles will need images of each vehicle in various environments and conditions to accurately identify vehicles in a real-world setting.
- Complexity. In computer vision, if objects are difficult to find due to environment, occlusion, camera focus, or other issues, including examples of those objects in a more easily identifiable image or video in the dataset will help the model train faster.
Sampling methods
Many ML teams use random sampling (the assets chosen are completely random) or stratified sampling (the assets chosen are random, but include equal examples of every class based on metadata) methods to produce their dataset for each iteration. While random sampling might work well for the first couple iteration cycles, where the model only needs to develop a basic understanding of the task at hand, it becomes inefficient over time. When teams employ random sampling for further iterations, performance gains are generally small. Stratified sampling doesn’t consistently show results either, mostly because metadata doesn’t always capture the right information for the team's specific use case.
The sampling method that typically works best with a data-centric approach to ML is weak supervision via labeling functions. Labeling functions can be created to group assets by a weak classifier — for example, in a computer vision use case, a labeling function can sort through a dataset and loosely label all images likely to have a specific class or object. This tool is not perfectly accurate, but it can help ML teams quickly sort their data based on the categories they’ve identified during model diagnosis.
Combining this weak supervision method with stratified and/or random sampling will help teams curate a dataset most likely to significantly improve model performance.
Labelbox makes it easy for ML teams to create labeling functions and visually sort their data with Catalog. Check out our other posts on data-driven labeling and data discovery to learn more about our data curation and model diagnosis tools. You can also watch our on demand webinar, How to diagnose and improve model performance, for more details and a demo.