All posts
Identifying and counting avian blood cells in whole slide images via deep learning
Summary: Avian blood analysis is a fundamental method for investigating a wide range of topics concerning individual birds and populations of birds. Determining precise blood cell counts helps researchers gain insights into the health condition of birds. For example, the ratio of heterophils to lymphocytes (H/L ratio) is a well-established index for comparing relative stress load. However, such measurements are currently often obtained manually by human experts. The researchers presented a novel approach to automatically quantify avian red and white blood cells in whole slide images, based on two deep neural network models. The first model determined image regions that are suitable for counting blood cells, and the second model is an instance segmentation model that detected the cells in the determined image regions.
Challenge: Automated visual and acoustic monitoring methods for birds can provide information about the presence and the number of bird species or individuals in certain areas, but analyzing the physiological conditions of individual birds allows researchers to understand potential causes of negative population trends.
For example, measuring the physiological stress of birds can serve as a valuable early warning indicator for conservation efforts. The physiological conditions and the stress of birds can be determined in several ways, e.g., by assessing the body weight or the fat and muscle scores in migratory birds. Other frequently used methods are investigating the parasite loads, measuring the heart rates, and measuring the levels of circulating stress hormones, such as corticosterone.
Findings: The region selection model achieves up to 97.3% in terms of F1 score (i.e., the harmonic mean of precision and recall), and the instance segmentation model achieves up to 90.7% in terms of mean average precision. The approach can help ornithologists acquire hematological data from avian blood smears more precisely and efficiently.
How Labelbox was used: The researchers used the Labelbox platform annotating images of our datasets with model-assisted labeling. The instance segmentation dataset was annotated in an iterative, model-assisted manner, using the tile selection network to propose regions to be annotated and eventually selected them based on how many rare cells had been detected by an intermediate instance segmentation model.
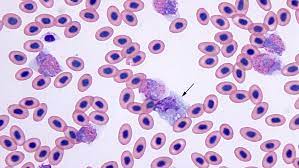
In the very first iteration, they used a superpixel algorithm to generate simple instance masks. In each iteration, they uploaded the corresponding instance segmentation masks to Labelbox to be refined by our human expert. This procedure significantly reduced the time needed to fully annotate an image file with masks and class labels compared to annotating from scratch. Overall, they went through four iterations of labeling. For the annotated cell instances, they established two primary categories: erythrocyte, with only the nucleus annotated, and leukocyte. The latter was further split into five subtypes, namely, lymphocyte, eosinophil, heterophil, basophil, and monocyte. Thrombocytes were not explicitly annotated; they were considered to be part of the background during training.
The trained neural network model was able to distinguish between non-relevant thrombocytes and other annotated cell types, e.g., erythrocytes. By annotating only the nucleus of each erythrocyte rather than the entire cell including the cytoplasm, they maintained the option to label parasite-infected instances individually in future work. Cells infected with parasites may be annotated by masking the entire cell including the cytoplasm. One erythrocyte can be simultaneously counted as both an erythrocyte and a cell with blood parasite because of the distinct annotation regions.
You can read the full paper here.