
 All blog posts
Labelbox•August 22, 2023
How to set up your labeling ops for success with observability

When the Dialpad team couldn’t meet the quality standards with their data labeling service as, for example, they struggled to scale their AI projects. After months of slow feedback loops with few performance gains, the team decided to implement a labeling operations solution that prioritized labeling quality and speed by providing observability features via a performance dashboard.
For many AI teams, getting high-quality training data is a challenge. Improving labeling quality is often integral to scaling up AI development. Labeling quality refers to the accuracy, consistency, and reliability of the annotations produced by human labelers or automated labeling models. It quantifies the extent to which the annotations align with the desired ground truth and meet the requirements of the specific labeling task. The quality of labeled data is considered the single most important factor in predicting the performance of the model.
In this blog post, we’ll explore how labeling quality can be measured and improved with the right observability practices for labeling operations.
Setting up performance and quality probes
To ensure the best business outcome, labeling operations need to strike the right balance between agility and quality, since both are essential to cutting costs while building a robust machine learning model. From an operational perspective for labeling operations, this optimization translates to the measurements:
- Throughput: How quickly is data being is labeled?
- Efficiency: Is the team only labeling and reviewing what is needed?
- Quality: Do the labels generated meet the quality requirements?
In the following sections, we will define each measurement, show how labeling operations teams can visualize them, and explore what actions teams can take based on certain conditions.
Throughput
Throughput, defined as the rate at which items pass through a process, is the foundational metric to consider in large scale labeling operations. The following need to be considered when measuring throughput:
- Rate at which data rows enter the project
- Rate at which annotations and labels are created
- Rate at which data rows are done with QA
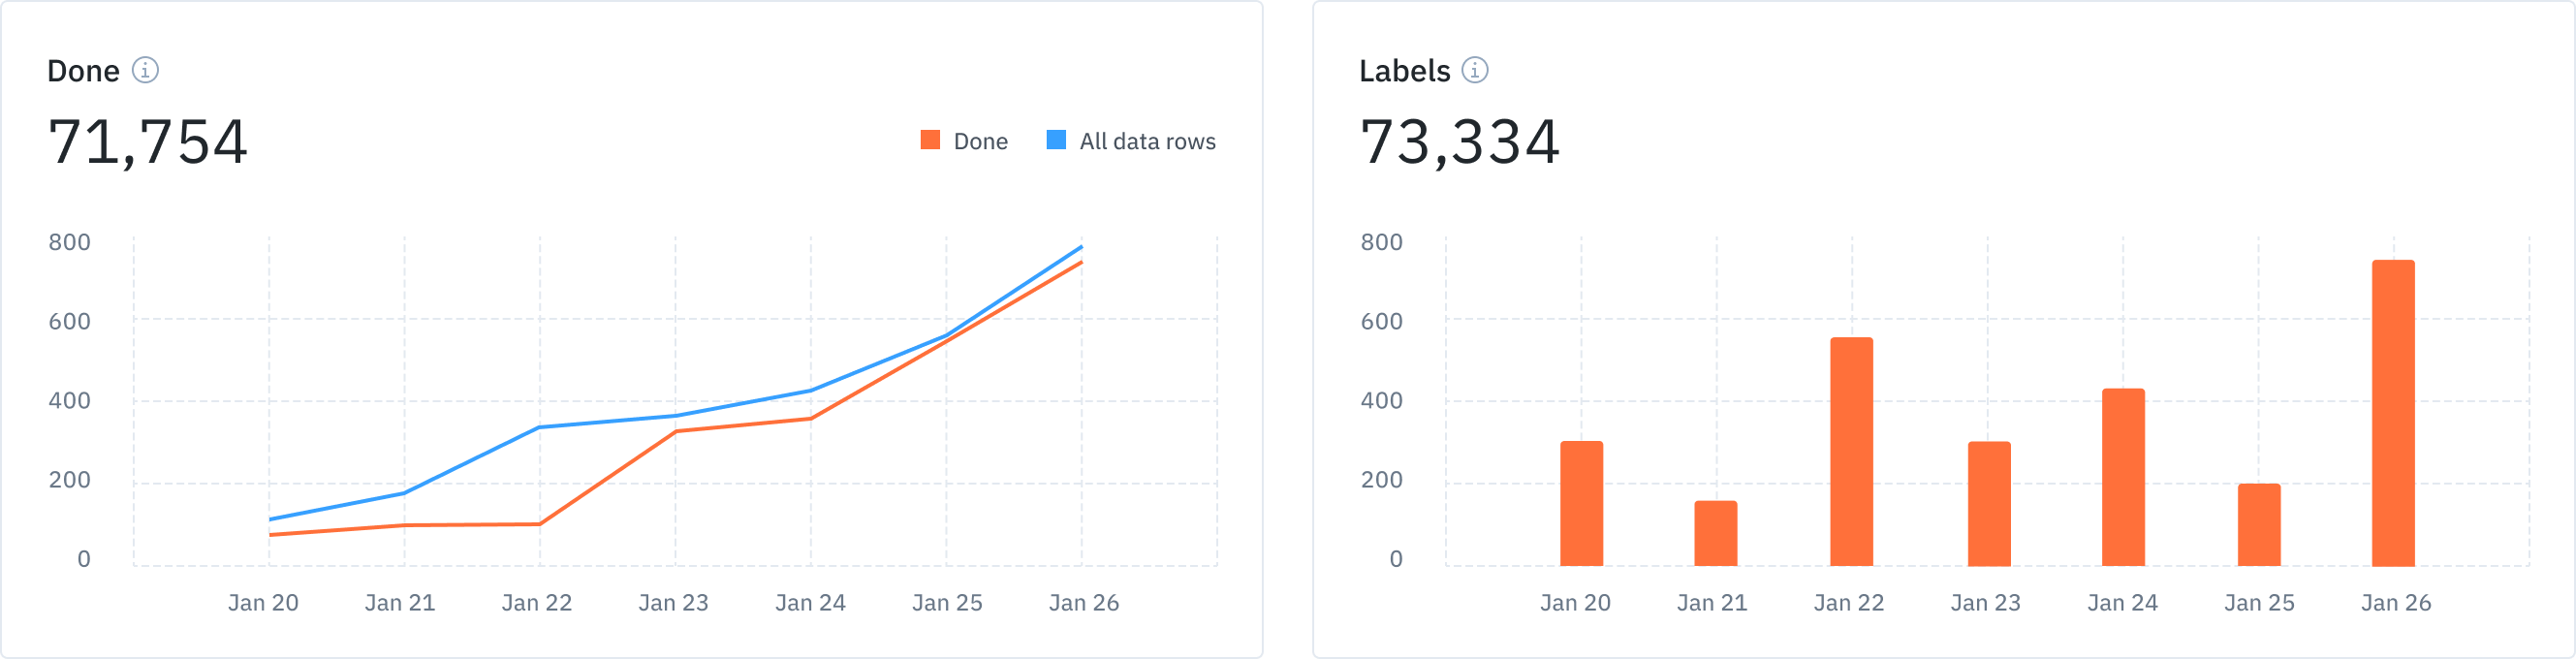
The metrics for All (meaning all datarows in the project) and Done (meaning all labeled and approved datarows in the project) would both typically increase at a steady rate to keep the model iterations going. If there are cases where there is a mismatch between the rate of data rows entering and getting marked as done in the project, it could point to a potential gap in expectations of speed vs quality between the machine learning and the labeling operations teams. Some possible next steps are:
- Bring the teams together to communicate on speed and quality expectations, bringing specific examples to the fore. Use a capability like Updates that allows for in-app communication between different organizations, all within the context of the labeling being done.
- In case these conversations yield potential efficiency gains by restructuring processes, such as reviewing in a more targeted fashion, use a tool like Workflows, which allows you to set up multi-step customized review flows involving different teams.
Efficiency
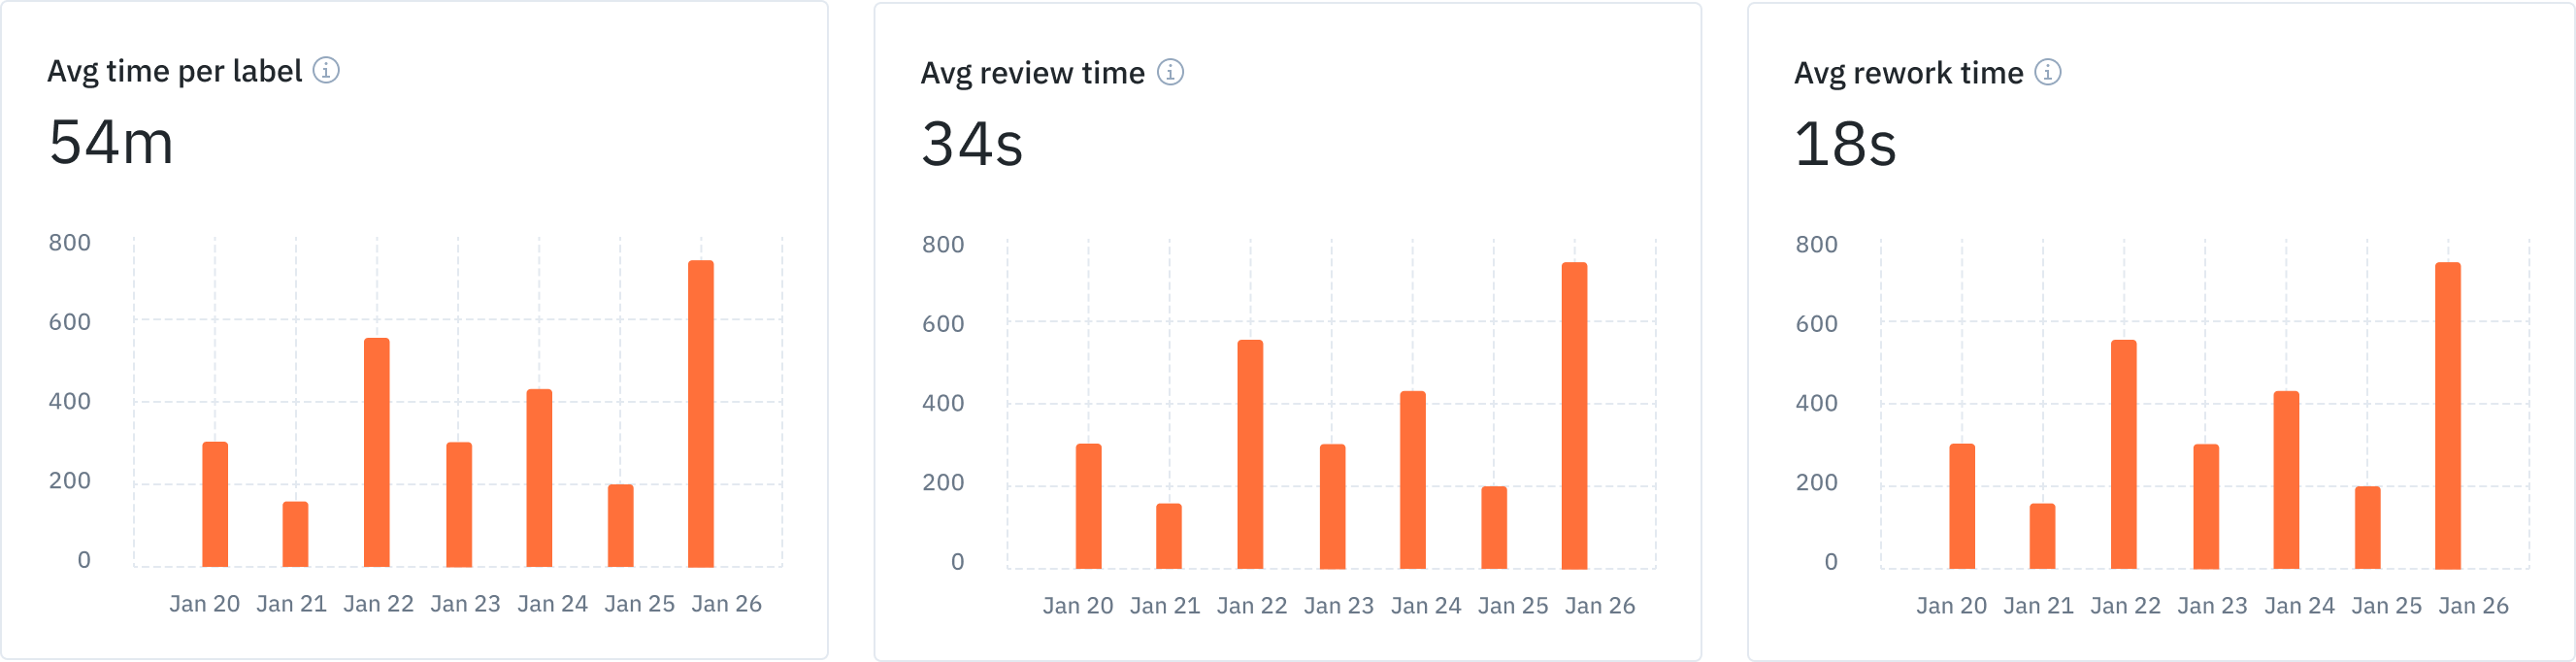
Efficiency, in the context of labeling operations, reflects on the turnaround time of quality labels. Efficiency includes considers the following measurements:
- Labeling time, measured as the time taken for the initial label version submitted
- Rework time, measured as the time taken by anyone, including the original annotator, to modify the initial label version submitted
- Review time, measured as the time taken by anyone, including the original annotator, to review the initial label version, add comments for feedback, etc.
With these metrics, you can take the following actions:
- Keeping a steady quality bar, the typical objective is to reduce the turnaround time, including all of labeling, review, and rework times
- To set the right standards for labeling time, you’ll need to have a set of initial labeled examples that also serve as gold standard labels (see benchmarks)
- If the average label time significantly exceeds the expected label time, try approaches like bulk classification and/or model-assisted labeling to kickstart the labeling process
Quality
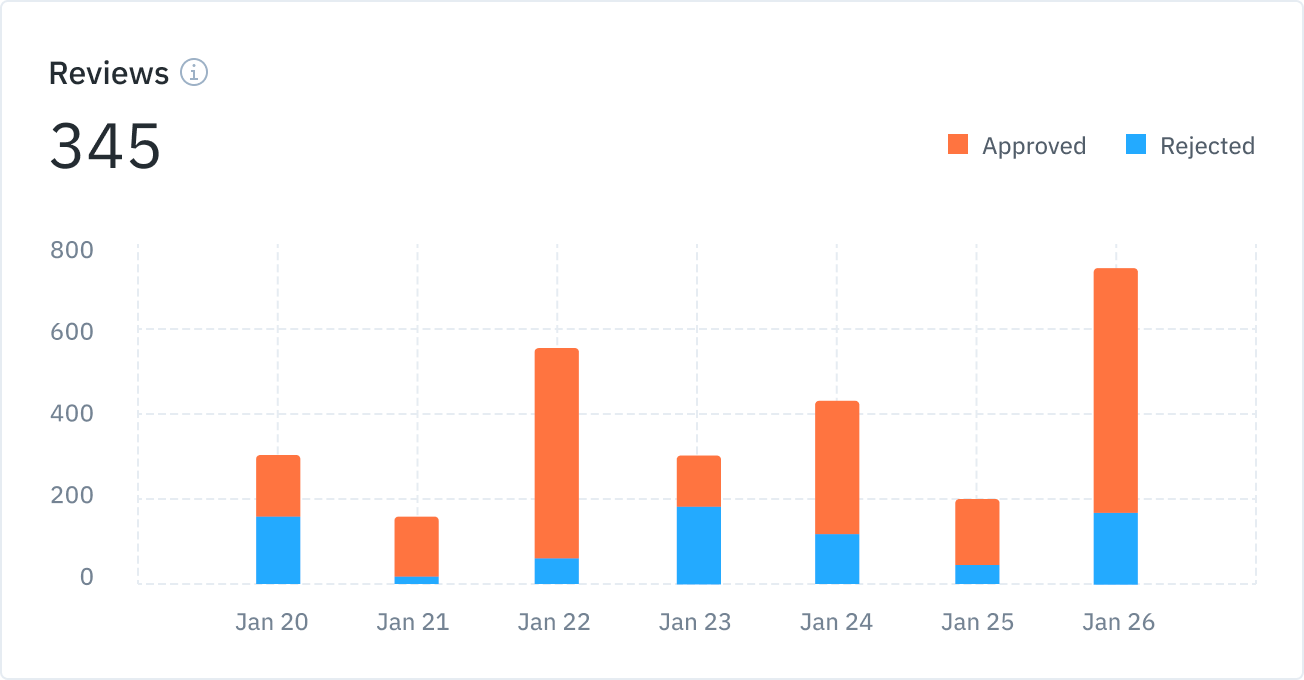
There are two levels to measuring labeling quality that are considered best practices in labeling operations: human review and agreement.
Quality measured by human review is typically the rate at which labels are accepted or rejected when audited by human reviewers. Human reviews, often done by subject matter experts, can be expensive. It is thus important to ensure that your team reviews only when needed. Setting up a customizable review workflow can help balance quality requirements with review expenses.
Agreement based quality looks at agreement between labels. Teams can look at consensus scores (inter-annotator agreement between labels created on the same asset) and benchmark scores (agreement between labels created by annotators and a gold standard label).
With quality metrics, if the agreement rate is below your expected SLA (for example, 90%), you should dig deeper to understand error patterns with specific examples.
If you’re using Labelbox, you can easily filter your data to root out these error patterns. Once you have identified these error patterns, you can communicate feedback to your annotation teams and/or perform a similarity search to proactively identify potential issues in bulk to improve labeling quality.
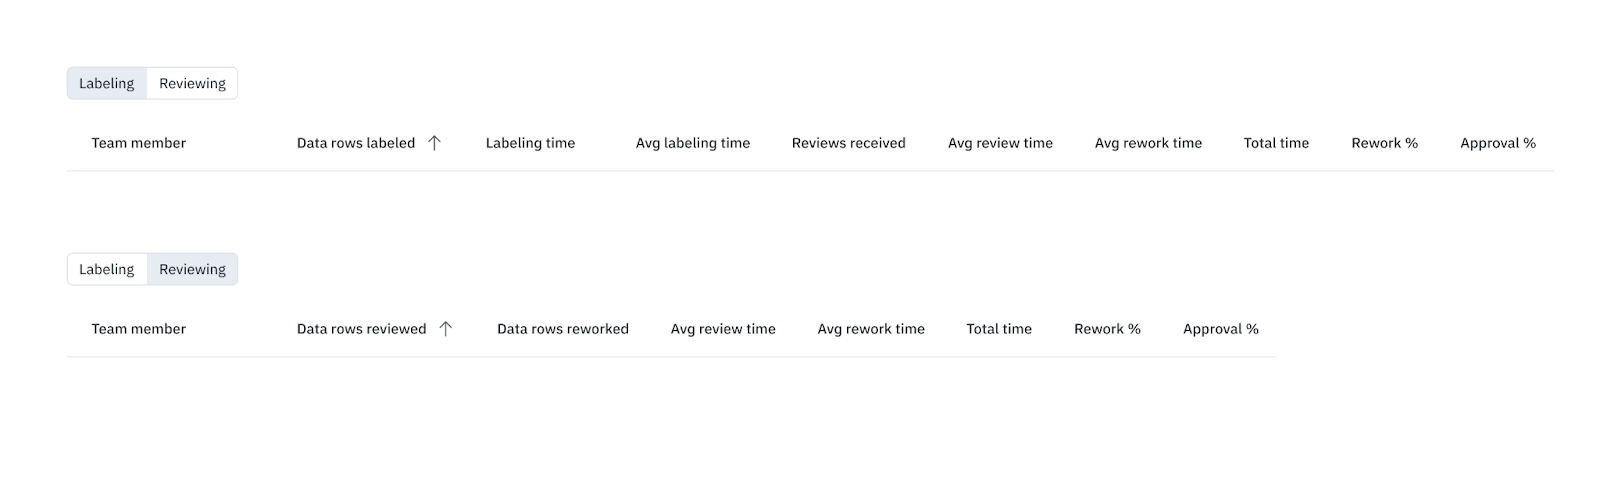
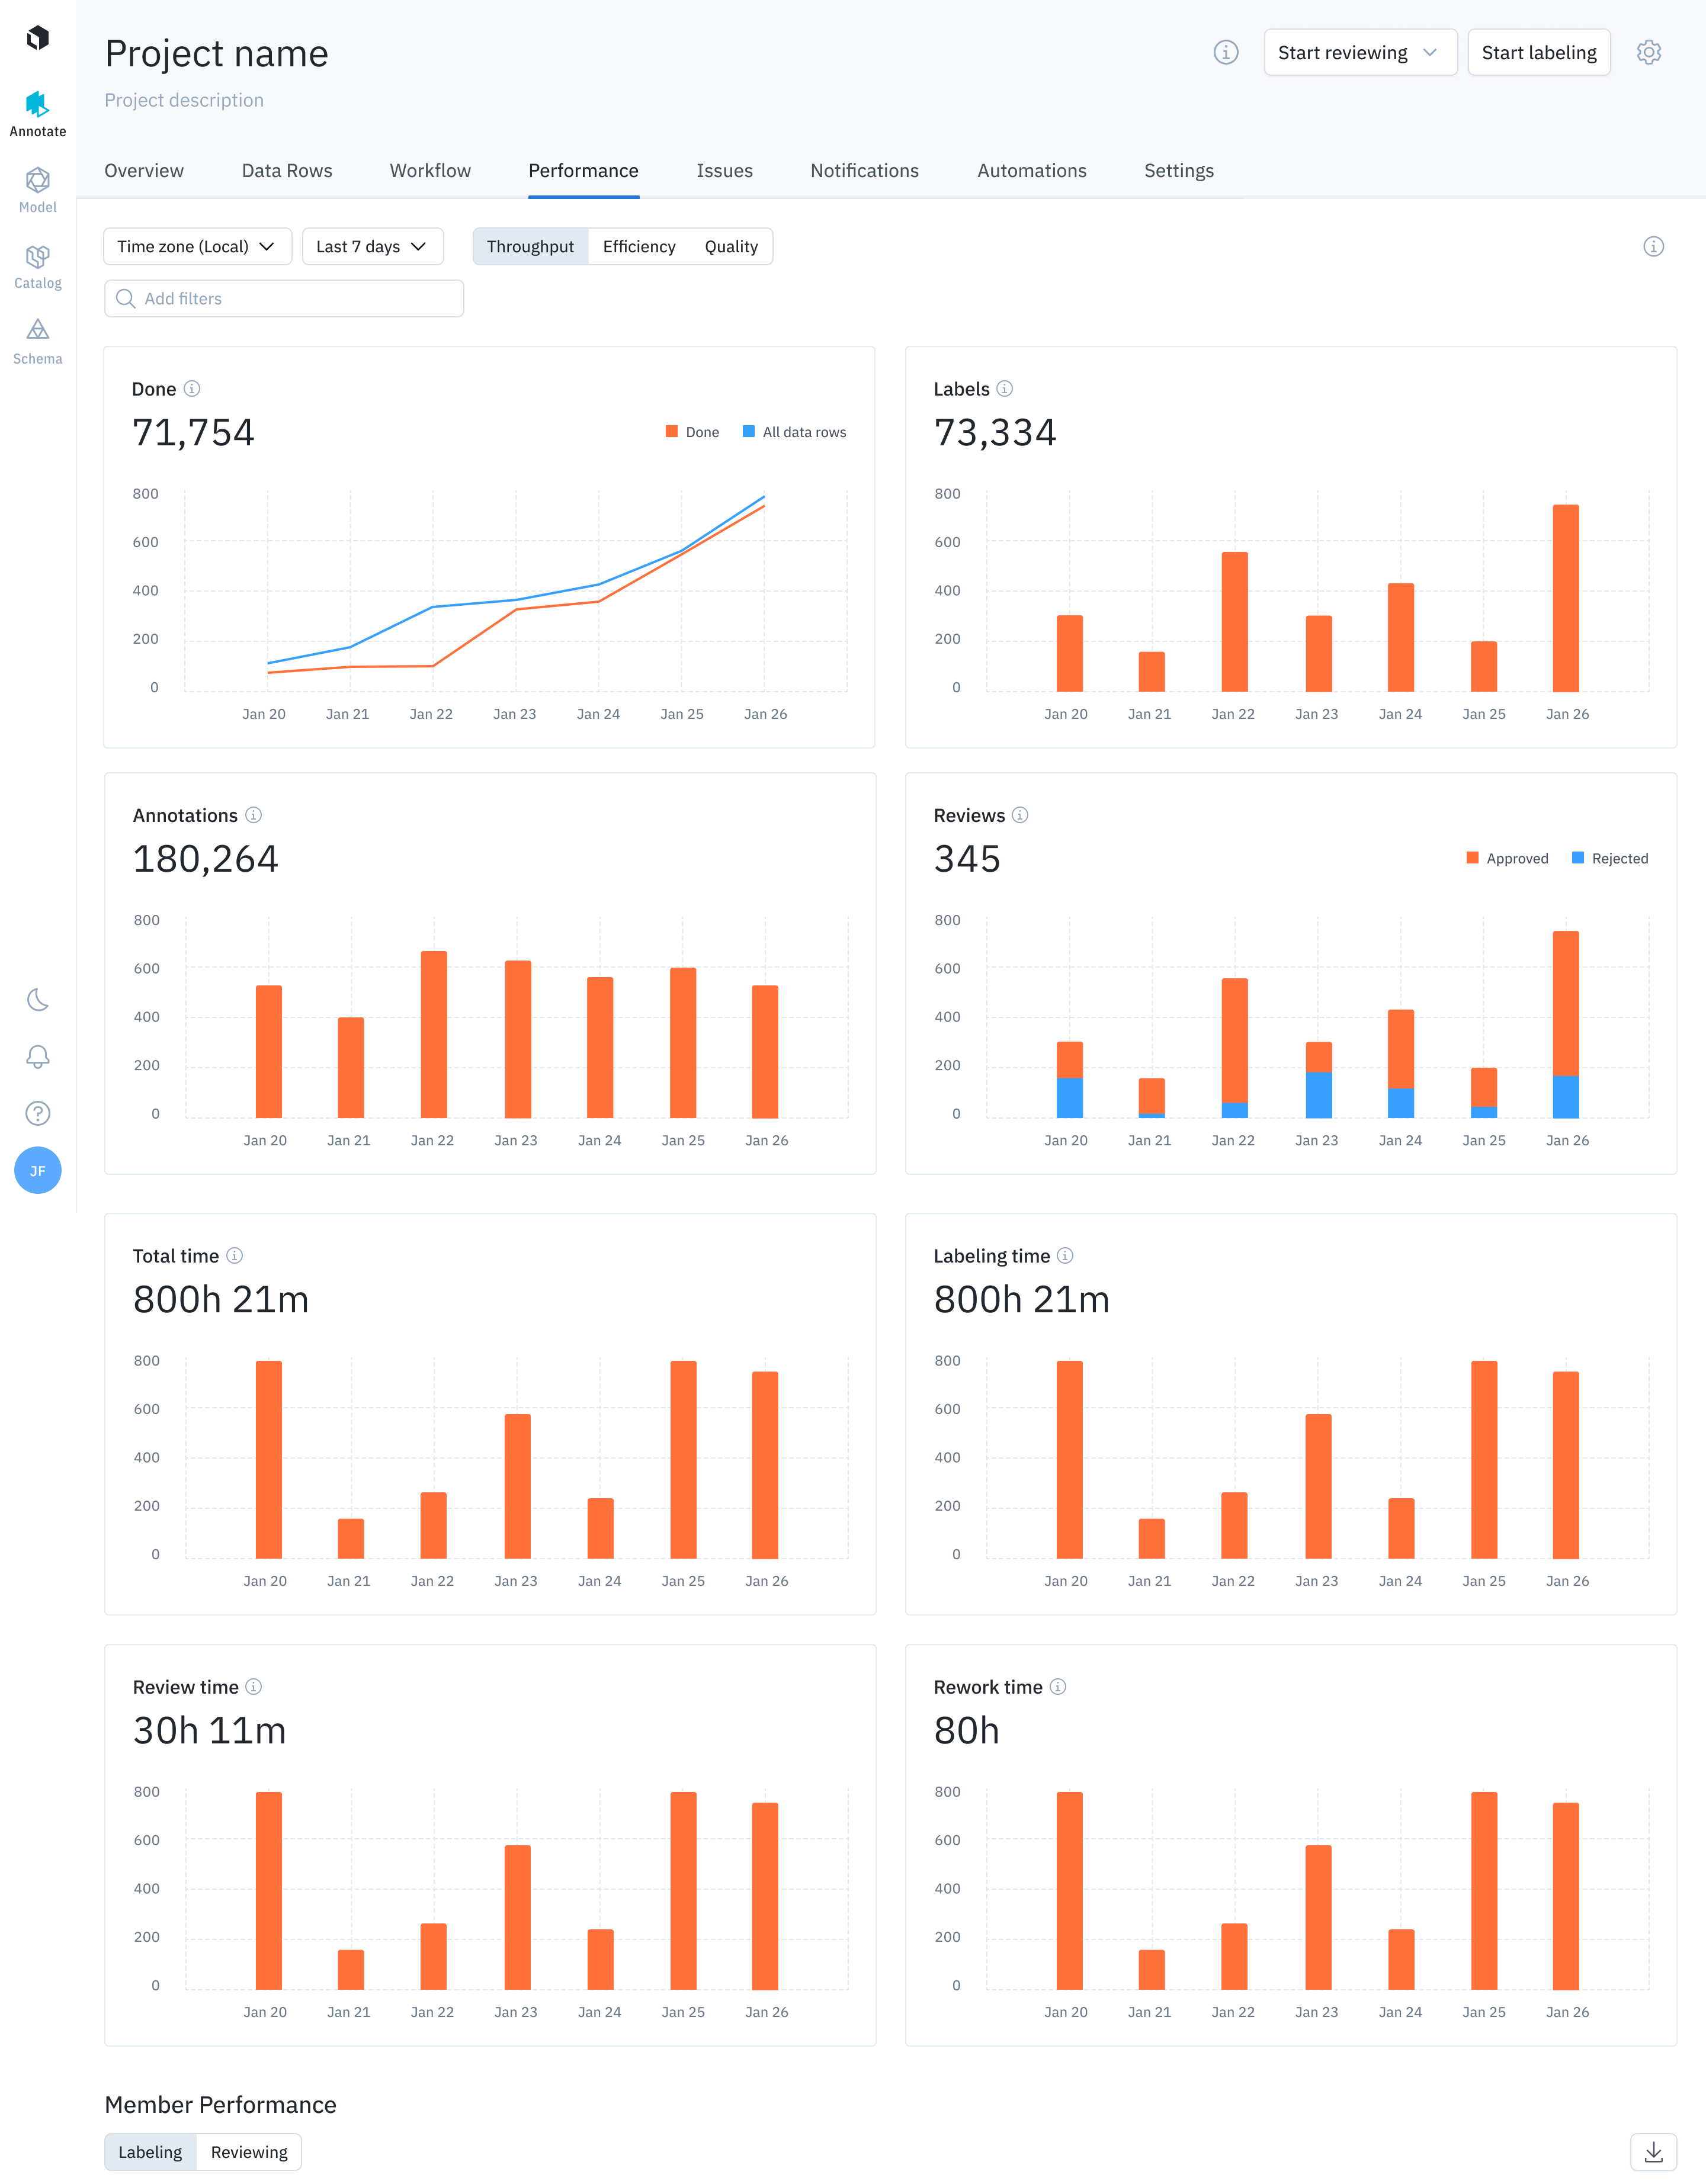
Once you have set these probes up, they should be monitored continuously as new data gets added and new quality issues get surfaced. Labelbox’s performance dashboard empowers AI teams with near-real time performance metrics, including throughput, efficiency, and quality metrics at the aggregate level, as well as the ability to explore this the data using filters. This observability enables teams to not only ensure that all their labels are high quality, but also to accelerate their labeling process, cutting their overall annotation and review costs. Try it today for free.


